Page 27 of 147 FirstFirst ... 17 25 26 27 28 29 37 77 127 ... LastLast
Results 261 to 270 of 1461

Daily Market Analysis By FXOpen

This is a discussion on Daily Market Analysis By FXOpen within the Analytics and News forums, part of the Trading Forum category; ETHUSD and LTCUSD Technical Analysis – 11th NOV, 2021 ETHUSD: Evening Star Pattern Above $4,500 We observed Ethereum moving in ...


  1. #261
    Junior Member FXOpen Trader's Avatar
    Join Date
    Dec 2020
    Location
    Asia
    Posts
    1,772
    ETHUSD and LTCUSD Technical Analysis – 11th NOV, 2021


    ETHUSD: Evening Star Pattern Above $4,500

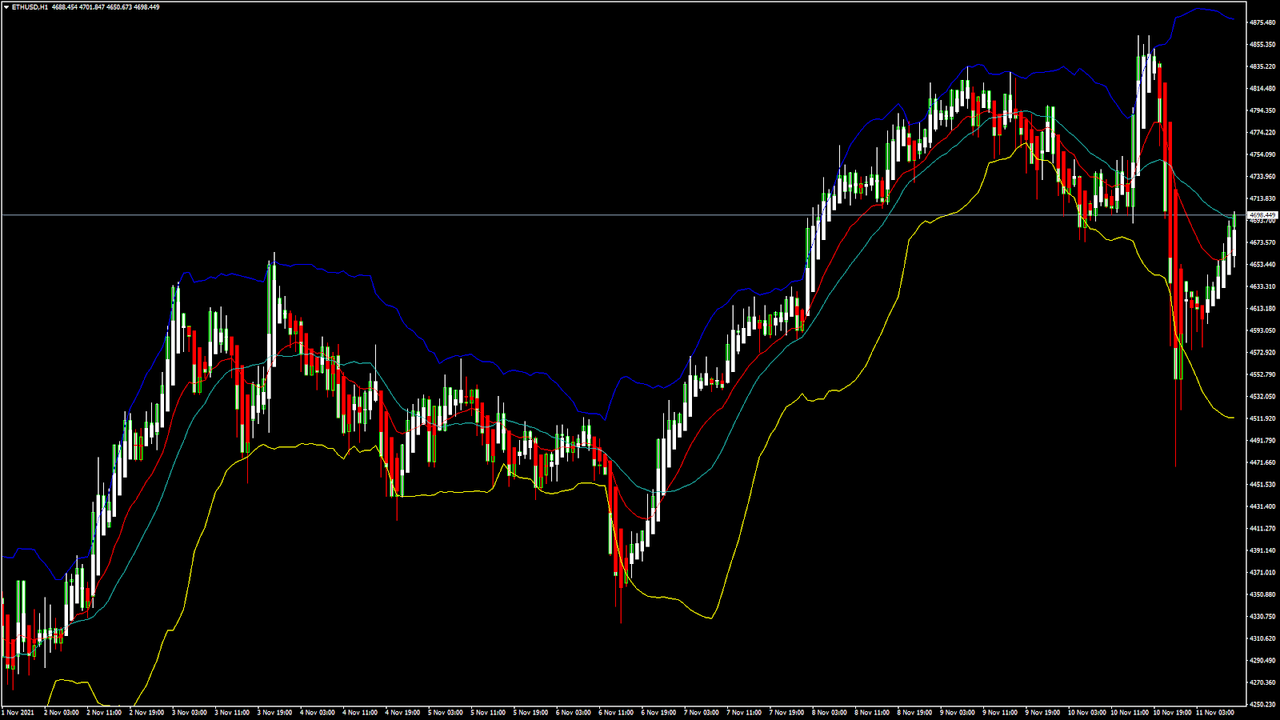
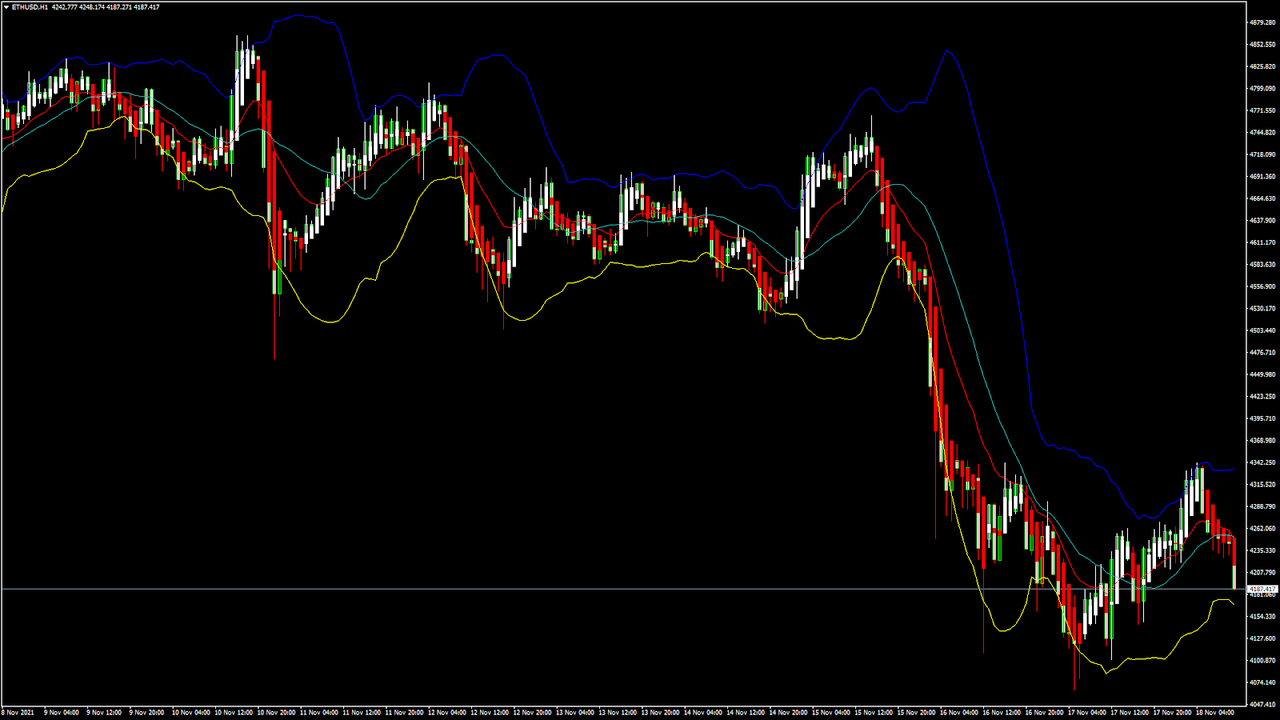
    We observed Ethereum moving in a bearish channel after it touched an all-time high of $4,865, continuing with a sharp drop in profit-taking seen across all the major cryptocurrency exchanges.

    The price dynamics of Ethereum has shown an Evening Star pattern above the $4,500 handle, signifying a potential reversal of the bearish trend and the continuation of the medium to long-term bullish trend.

    ETHUSD touched an intraday high of $4,847 in yesterday’s US trading session, after which the price saw a downward correction of more than 7%, dropping to an intraday low of $4,471. A consolidation wave towards the level of $4,600 followed next.

    ETH is now trading above its classic support level of $4,647 and Fibonacci support level of $4,675. In today’s US trading sessions, it is forming a bearish trend reversal pattern and is about to enter the bullish channel once again.

    The bearish correction occurred due to profit taking seen at higher levels, but the dips remain well supported. The price of Ethereum continues to trade above the $4,600 handle in the European trading session.

    All the major technical indicators are giving a STRONG BUY signal.

    ETH is now trading just above its 200 hourly simple and exponential moving averages.

    • Ethereum trend reversal pattern is seen above the level of $4,500
    • Mid-term range appears to be bullish for ETHUSD
    • Average true range indicates less market volatility
    • Relative strength index is NEUTRAL


    Ether Bearish Trend Reversal Above $4,500 Confirmed


    ETHUSD has been surging in a steep trend line since 20th Jul, 2021 when it was ranging at the level of $1,700, yielding its long-term investors profits on a continuous basis.

    The uptrend rally is not yet over, and we are still awaiting for Ether to cross the $5,000 handle, after which more upsides will be seen towards the $5,200 to $5,500 range in the coming months.

    At present, the price of Ethereum is in a aub-consolidation phase, forming a bearish trend reversal pattern since yesterday.

    The relative strength index is at 45, indicating a NEUTRAL market; we could see a range bound movement in the prices of ETHUSD in the US trading session today.

    ETH has lost 0.22% with a price change of -$10.33 in the past 24hrs, and has a trading volume of 23.638 billion USD.

    The Week Ahead

    We have seen a moving averages crossover in the 5-hour range, which signifies a short-term potential trend reversal. ETHUSD will need to remain above the $4,700 handle for the bullish trend confirmation, and this week, we are looking for levels of $4,800 to $4,950.

    StochRSI is OVERBOUGHT which indicates that the prices are going to REVERSE very soon.

    The current levels are very attractive for entering into the markets with the target of $5,000.

    The price of ETHUSD has already broken its pivot level of $4,674 and Fibonacci resistance level of $4,700. We should see the prices of ETHUSD touching an all-time high again next week, printing at above the $5,000 handle.

    Technical Indicators:

    Stoch (9,6): at 74.34 indicating a BUY

    Average directional change (14-day): at 21.96 indicating a BUY

    Ultimate oscillator: at 68.83 indicating a BUY

    Commodity channel index (14-day): at 60.54 indicating BUY

    Read Full on FXOpen Company Blog...

  2. #262
    Junior Member FXOpen Trader's Avatar
    Join Date
    Dec 2020
    Location
    Asia
    Posts
    1,772
    Gold Price Gains Momentum While Crude Oil Price Faces Hurdle


    Gold price is trading in a positive zone above the $1,825 support. Crude oil price is facing hurdles near $82.20 and $83.00.

    Important Takeaways for Gold and Oil

    • Gold price started a decent increase above the $1,820 resistance against the US Dollar.
    • There is a key bullish trend line forming with support near $1,842 on the hourly chart of gold.
    • Crude oil price is struggling to gain pace for a move above the $82.20 level.
    • There was a break below a major bullish trend line with support near $81.65 on the hourly chart of XTI/USD.


    Gold Price Technical Analysis

    Gold price started a fresh increase above the $1,800 pivot level against the US Dollar. The price gained pace and it was able to settle above the $1,820 resistance zone.

    The price even settled above the $1,820 level and the 50 hourly simple moving average. Finally, there was a break above the $1,850 level. A high was formed near $1,867 on FXOpen and the price corrected lower. There was a break below the $1,860 level and the $1,855 support.

    Gold Price Hourly Chart


    The price even traded below the 50% Fib retracement level of the upward move from the $1,822 swing low to $1,867 high.

    However, the bulls remained active near $1,842. The price is also stable above the 61.8% Fib retracement level of the upward move from the $1,822 swing low to $1,867 high. Besides, there is a key bullish trend line forming with support near $1,842 on the hourly chart of gold.

    The price is back above the $1,855 level and the 50 hourly simple moving average. An immediate resistance on the upside is near the $1,862 level.

    The main resistance is near the $1,870 level. A close above the $1,870 level could open the doors for a steady increase towards $1,885. The next major resistance sits near the $1,900 level. On the downside, an initial support is near the $1,855 level.

    The first major support is near the $1,850 level. A downside break below the $1,850 support zone may possibly spark a steady decline. In the stated case, the price could test the $1,820 support.

    Read Full on FXOpen Company Blog...

  3. #263
    Junior Member FXOpen Trader's Avatar
    Join Date
    Dec 2020
    Location
    Asia
    Posts
    1,772
    EURO AT MULTI-MONTH LOW


    This Tuesday morning, the euro futures on the CME are trading below the psychological level of 1.14. Compared with the May 25 high of 1.227, the drop has already amounted to more than 7%. The last time the euro traded below 1.14 was in July 2020.

    One of the drivers that pushed the euro below the 1.14 level was European Central Bank President Christine Lagarde’s Monday comments. She positioned that inflation would remain high in the Eurozone for longer than previously expected. “Despite the current inflation surge, the outlook for inflation over the medium term remains subdued,” she said.

    But it is too early to raise the interest rate. Given the time lag characteristic of monetary policy implementation, tightening measures would do more harm than good, Lagarde added.

    This means that the euro emission policy will continue, so the EURUSD rate has reasonably decreased, but from a technical point of view, we can expect a rebound.

    The 1.14 mark served as a strong resistance (1) in stormy March 2020. In June, this level proved its significance once again (2), but was broken through upwards against growing volumes (3) in July 2020. Now we may see 1.14 acting as support and being effective at least to some degree, which, however, may prove to be sufficient for speculation on the short-term horizon.

    FXOpen Telegram Channel

  4. #264
    Junior Member FXOpen Trader's Avatar
    Join Date
    Dec 2020
    Location
    Asia
    Posts
    1,772
    SATOSHI NAKAMOTO'S IDENTITY COULD BE REVEALED IN COURT

    The identity of bitcoin creator Satoshi Nakamoto, who had appeared exclusively online before vanishing in 2011, remains a mystery. The glory of the creator of the world’s principal cryptocurrency and alleged holder of 1.1 million bitcoins haunts many a crypto enthusiast.

    Various versions suggest that the bitcoin creator hiding under the pseudonym is Dorian Nakamoto, Nick Szabo, or Hal Finney, but these theories have not been confirmed.

    Today, the person in the media spotlight is Craig Wright, a programmer who, for several years now, has been claiming he is the notorious Satoshi Nakamoto. While the general public considers the evidence he’s presented to be inconclusive, his story has taken an unexpected turn.

    The family of Dave Kleiman, a programmer who contributed to bitcoin’s creation but died in 2013, sued Wright in Florida, demanding that he share the 1.1 million bitcoins. The family's lawyer claims to possess evidence that Kleiman had mined the coins that are stored in Satoshi's wallet.

    It is up to the court to rule out whether Wright is who he claims to be and whether he should share his stash of bitcoin. One important thing is that if Satoshi's identity is confirmed, Wright will become the most authoritative personality in the crypto world, dramatically affecting the BTCUSD rate.

    So far, bitcoin has been weakening, which we talked about in our earlier publications.

    November 10 (1) saw high sales volumes. They held back the upside attempt on November 14-15 (2) and jeopardized the trendline (3), which has now been broken. Note that the November 15 high (2) is 50% of the AB decline, while the November 14 bullish candlestick has low volume (5), implying weak demand. All of this paints a bearish picture. We expect an attempt to test the breakdown of line (3).


    FXOpen Telegram Channel

  5. #265
    Junior Member FXOpen Trader's Avatar
    Join Date
    Dec 2020
    Location
    Asia
    Posts
    1,772
    Rivian Doubles in Price In Less Than One Week Since Its IPO


    Rivian (NASDAQ:RIVN) is an electric vehicle startup backed by Jeff Bezos, the CEO of Amazon. It listed its shares last week on NASDAQ at an IPO (initial public offering) price of $78. To the surprise of many market participants, the stock price has doubled in just one week since then, trading close to $170/share, resulting in a market capitalization larger than that of some well-established companies such as Volkswagen.

    Investors still bet big on renewable energy solutions, as many governments in the developed world plan to phase out the combustion engine in the next decade or so. As such, electric vehicle companies have surged on the world's stock exchanges, even though they are not manufacturing that many vehicles.

    Take Rivian — founded in 2009, it currently employs about 6,000 people. In the first trading week, the stock market performance propelled the company above Ford's market capitalization, despite Ford employing 178,000 people and delivering far more cars.

    Other Electric Vehicle Makers Have Seen Stock Price Surge in 2021


    Rivian's performance in the first trading week since it became a publicly listed company should not come as a surprise. While impressive, its stock price performance follows closely in the footsteps of other similar companies that have outperformed the market in 2021.

    Lucid Group (NASDAQ:LCID) is one of them. It develops electric vehicle technologies such as full cars as well as battery systems. The stock price has gone up over +340% this year alone.

    Tesla is another such company, only this time, it needs no introduction. Tesla is one of the world's biggest brands, and its charismatic CEO, Elon Musk, is constantly in the papers. Most recently, Musk held a Twitter poll asking if he should sell 10% of Tesla shares. Millions of voters urged him to do so — so he did. Yet, despite the massive selling, Tesla shares have rallied over +145% in the last twelve months, and more than +2,600% in the last five years. TSLA currently trades above $1,000 a share, as buyers emerged on every dip.

    All in all, the electric vehicle industry is popular among investors as governments fight to tackle climate change. Sky-high valuations seem to not matter for retail investors who want to get exposure to the industry and are willing to pay multiple times their current earnings.

    FXOpen Blog

  6. #266
    Junior Member FXOpen Trader's Avatar
    Join Date
    Dec 2020
    Location
    Asia
    Posts
    1,772
    ETHUSD and LTCUSD Technical Analysis – 18th NOV, 2021


    ETHUSD: Descending Triangle Pattern Below $4,300

    Ethereum failed to continue its bullish momentum this week and after touching an intraday high of $4,765 on 16th Nov, started a steep decline towards the $4,300 handle.

    We can see a descending triangle pattern below $4,300 which signifies that the downtrend is expected to continue as more and more traders are entering short positions in Ethereum in hopes of making profit from a falling market.

    ETHUSD touched an intraday low of $4,118 in the European trading session today, after which the prices stabilized and continue to trade above the $4,200 level.

    StochRSI is indicating OVERSOLD level, which means that the market is in a position to enter into a consolidation phase, and the prices will continue to move in a narrow range between $4,200 and $4,400.

    ETH is now trading below its pivot level of $4,243 and moving in continuation of a bearish trend. The price of ETHUSD is now testing its classic support level of $4,197 and its Fibonacci support level of $4,213. After this, the path towards $4,000 will get cleared.

    ETHUSD is facing heavy downwards pressure and has already broken its key support level of $4,240 today.

    All the major technical indicators are giving a STRONG SELL signal.

    ETH is now trading below both the 100 hourly and 200 hourly simple moving averages.

    • Ethereum is in continuation of a bearish channel
    • Short-term range appears to be bearish for ETHUSD
    • All the moving averages are giving a STRONG SELL signal
    • Williams percent range is indicating OVERSOLD markets


    Ether Bearish Trend Continuation Below $4,300


    ETHUSD has been moving in a steep downturn since yesterday, and this is a short-term bearish reversal of the market. The medium to long-term outlook for ETH remains bullish.

    The present market condition offers short-term traders to enter into SELL positions, with the immediate targets of $4,100 and $4,000.

    The price of ETHUSD will need to remain above the important psychological support level of $4,000 this week to mark the reversal of this bearish channel.

    The average true range is indicating low market volatility as we can see a drop of 26% in the trading volume as compared to yesterday. This means that fresh buyers are not willing to enter the markets given the bearish nature of the trend.

    ETH has gained +1.15% with a price change of +47.70$ in the past 24hrs and has a trading volume of 18.471 billion USD.

    The Week Ahead

    Ether is expected to continue this downtrend this week and touch the level of $4,100 or even break the $4,000 handle. Since the long-term bullish tone is still present, the dips below $4,000 will remain well supported and will continue to push the prices higher.

    StochRSI is OVERSOLD which indicates that the prices are going to REVERSE very soon.

    The current level is very attractive for entering into the markets with short-term position and the target of $4,000.

    The price of ETHUSD has already broken its Camarilla support level of $4,234 and further downsides are expected below $4,200 in the coming days. Next week, we can expect a reversal of this bearish trend.

    Technical Indicators:

    Stoch (9,6): at 26.571 indicating a SELL

    Relative strength index (14-day): at 43.318 indicating a SELL

    Ultimate oscillator: at 39.654 indicating a SELL

    Rate of price change: at -0.687 indicating a SELL

    Read Full on FXOpen Company Blog...

  7. #267
    Junior Member FXOpen Trader's Avatar
    Join Date
    Dec 2020
    Location
    Asia
    Posts
    1,772
    Gold Price and Crude Oil Price Could Start Fresh Increase


    Gold price is trading in a positive zone above the $1,850 support. Crude oil price must clear $80.00 to start a fresh increase in the near term.

    Important Takeaways for Gold and Oil

    • Gold price started a decent increase above the $1,850 resistance against the US Dollar.
    • There is a key contracting triangle forming with resistance near $1,865 on the hourly chart of gold.
    • Crude oil price corrected lower below $80.00 and tested the $76.50 zone.
    • There was a break above a key bearish trend line with resistance near $78.50 on the hourly chart of XTI/USD.


    Gold Price Technical Analysis


    Gold price started a fresh increase above the $1,820 resistance level against the US Dollar. The price gained pace and it was able to settle above the $1,842 resistance zone.

    The price even settled above the $1,850 level and the 50 hourly simple moving average. Finally, there was a break above the $1,870 level. A high was formed near $1,877 on FXOpen and the price corrected lower. There was a break below the $1,865 level, but the bulls remained active near $1,850.

    A low is formed near $1,850 and the price is now rising. The price is back above the $1,860 level and the 50 hourly simple moving average. It also surpassed the 50% Fib retracement level of the recent decline from the $1,871 swing high to $1,850 low.

    An immediate resistance on the upside is near the $1,863 level. It is near the 61.8% Fib retracement level of the recent decline from the $1,871 swing high to $1,850 low. The first major resistance is near the $1,865 level.

    There is also a key contracting triangle forming with resistance near $1,865 on the hourly chart of gold. The main resistance is near the $1,870 level. A close above the $1,870 level could open the doors for a steady increase towards $1,885.

    The next major resistance sits near the $1,900 level. On the downside, an initial support is near the $1,855 level. The first major support is near the $1,850 level. A downside break below the $1,850 support zone may possibly spark a steady decline. In the stated case, the price could test the $1,820 support.

    Read Full on FXOpen Company Blog...

  8. #268
    Junior Member FXOpen Trader's Avatar
    Join Date
    Dec 2020
    Location
    Asia
    Posts
    1,772
    GBP/USD and EUR/GBP At Risk of More Losses


    GBP/USD is struggling to clear the 1.3500 resistance zone. EUR/GBP is declining and remains at a risk of more losses below the 0.8380 support.

    Important Takeaways for GBP/USD and EUR/GBP

    • The British Pound is facing resistance near the 1.3500 and 1.3510 levels.
    • There was a break below a key bullish trend line with support near 1.3460 on the hourly chart of GBP/USD.
    • EUR/GBP started a fresh decline from well above the 0.8550 pivot level.
    • There is a major bearish trend line forming with resistance near 0.8420 on the hourly chart.


    GBP/USD Technical Analysis

    The British Pound found support near 1.3350 and started a decent recovery the US Dollar. The GBP/USD pair climbed higher above the 1.3400 and 1.3450 levels.

    The pair even spiked above the 1.3500 level, but there was no upside continuation. A high is formed near 1.3512 on FXOpen and the pair is now declining. The pair traded below the 1.3480 and 1.3450 support levels to enter a bearish zone.

    GBP/USD Hourly Chart


    There was a break below a key bullish trend line with support near 1.3460 on the hourly chart of GBP/USD. The pair declined below the 50% Fib retracement level of the upward move from the 1.3353 swing low to 1.3512 high.

    The pair is now trading below the 1.3450 and the 50 hourly simple moving average. On the upside, an initial resistance is near the 1.3450 level.

    If there is an upside break above the 1.3450 resistance and the 50 hourly SMA, the price could surpass 1.3480. The main resistance is near the 1.3500 zone. Therefore, a proper break above the 1.3500 resistance could open the doors for a steady increase. The next major resistance for the bulls could be 1.3600.

    If not, the pair could extend losses below 1.3425. An immediate support is near the 1.3415 level. It is near the 61.8% Fib retracement level of the upward move from the 1.3353 swing low to 1.3512 high.

    The first key support is near the 1.3400 level. Any more losses could lead the pair towards the 1.3350 support zone. The next major support sits near the 1.3250 level.

    Read Full on FXOpen Company Blog...

  9. #269
    Junior Member FXOpen Trader's Avatar
    Join Date
    Dec 2020
    Location
    Asia
    Posts
    1,772
    Euro Under Pressure as COVID Cases Mount


    Winter has arrived in Europe and, with it, a new wave of COVID-19 infections. Despite Europe doing a relatively good job at vaccinating the population, the current vaccination rate is not substantial enough to curb the infection in some countries.

    COVID-19 infections are mounting once again, thus putting pressure on economies. Austria, for example, announced a new three-week lockdown in a desperate attempt to stop the virus and also to save the ski season (that has just started), as the tourism industry contributes in no small measure to the Austrian GDP.

    Moreover, the country announced that vaccination will become compulsory starting from February next year. The development has triggered a decline in euro pairs, with the EURUSD exchange rate trading below 1.13, and the EURJPY below 129.

    Fed Turns Hawkish


    The Federal Reserve of the United States announced the tapering of its quantitative easing and a gradual phase-out of the bond-buying program. However, last week, some Fed members argued for a faster reduction to tapering and signaled at least one rate hike to come in 2022. As such, the divergence with other central banks will support the dollar in the period ahead.

    On the other hand, the European Central Bank clearly has no intentions of hiking the interest rate next year. As such, from a monetary policy perspective, the euro has no reason to rise anytime soon.

    All euro pairs have come under pressure, not only the EURUSD. The EURJPY, for instance, traded with a bid tone all year but failed at the 133 level. In a matter of just a few days, it declined below 129 despite the USDJPY holding above 114.

    EURGBP is another pair reflecting the euro’s weakness. In addition, the Bank of England has voiced some concerns about the rising inflation rate, which could mean it following in the Fed’s footsteps sooner rather than later. Therefore, further declines in the cross pair should be expected.

    All in all, the euro looks weak here ahead of Thanksgiving and at the start of the winter season. As COVID-19 puts pressure on the European economies again, traders have no incentives to buy the common currency.

    FXOpen Blog

  10. #270
    Junior Member FXOpen Trader's Avatar
    Join Date
    Dec 2020
    Location
    Asia
    Posts
    1,772
    EUR/USD Extends Decline, USD/CHF Gains Momentum


    EUR/USD started a fresh decline from well above the 1.1350 pivot zone. USD/CHF is rising, and it might extend gains above the 0.9350 level.

    Important Takeaways for EUR/USD and USD/CHF

    • The Euro failed to gain strength and declined below 1.1300 against the US Dollar.
    • There is a key bearish trend line forming with resistance near 1.1255 on the hourly chart of EUR/USD.
    • USD/CHF started a decent increase from the 0.9250 support zone.
    • There is a connecting bullish trend line forming with support near 0.9310 on the hourly chart.


    EUR/USD Technical Analysis

    The Euro attempted an upside break above the 1.1400 resistance zone against the US Dollar. The EUR/USD pair failed to gain strength and started a fresh decline.

    There was a clear break below the 1.1350 and 1.1300 support levels. The pair even broke the 1.1250 support and the 50 hourly simple moving average. Finally, there was a move below the 1.1230 level and a low is formed near 1.1226 on FXOpen.

    EUR/USD Hourly Chart


    The pair is now consolidating losses near the 1.1230 level. On the upside, an initial resistance is near the 1.1255 level. The 23.6% Fib retracement level of the recent decline from the 1.1373 swing high to 1.1226 low is also near 1.1255.

    There is also a key bearish trend line forming with resistance near 1.1255 on the hourly chart of EUR/USD. The next major resistance is near the 1.1300 zone.

    The 50% Fib retracement level of the recent decline from the 1.1373 swing high to 1.1226 low is also near the 1.1300 zone. A clear upside break above the 1.1300 zone could open the doors for a steady move.

    The next major resistance sits near the 1.1350 level. On the downside, an immediate support is near the 1.1225 level. The next major support is near the 1.1200 level.

    A downside break below the 1.1200 support could start another decline. The next major support sits near 1.1120.

    Read Full on FXOpen Company Blog...

Page 27 of 147 FirstFirst ... 17 25 26 27 28 29 37 77 127 ... LastLast

Bookmarks

Posting Permissions

  • You may not post new threads
  • You may not post replies
  • You may not post attachments
  • You may not edit your posts
  •