BTC and XRP Ė Recovery shortly expected
BTC/USD
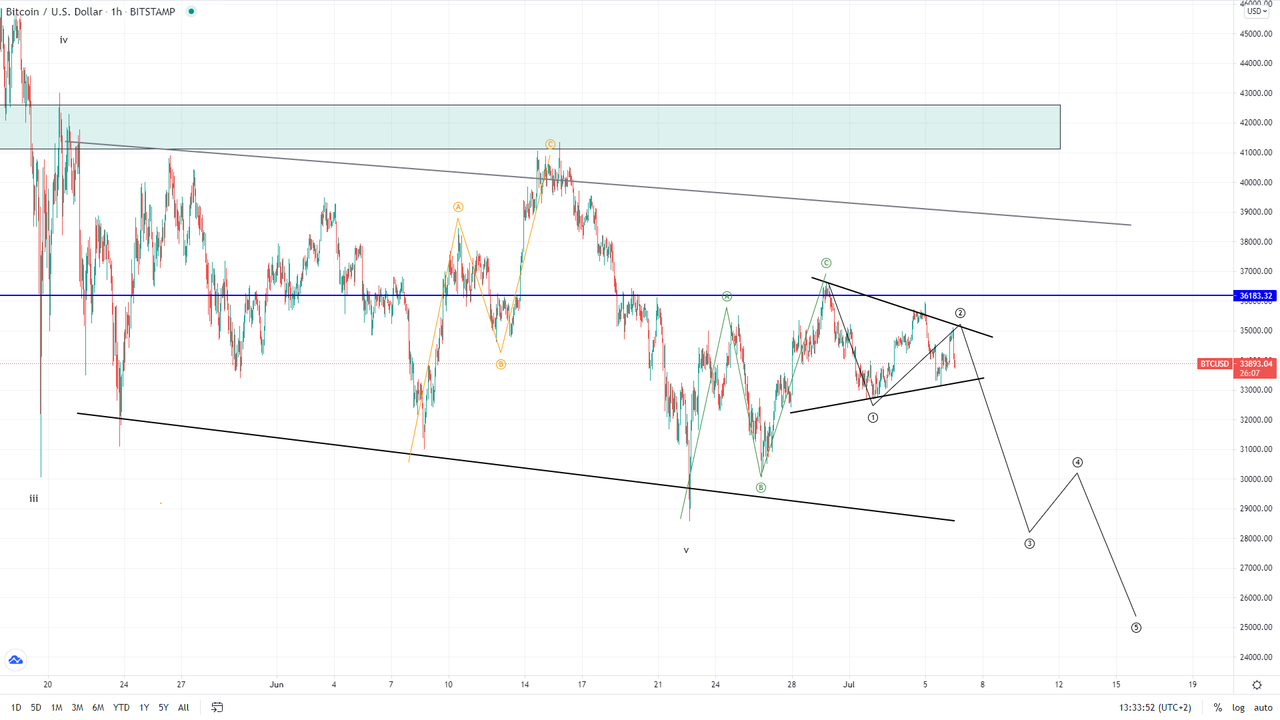
The price of Bitcoin has been on a decline since the 15th of June when it was trading at $41,151 at its highest point. From there we have seen a decrease of 24.5% measured to its lowest point today at around $31,240. Now the price is slightly higher but is currently testing the horizontal support level from the 23rd of May.
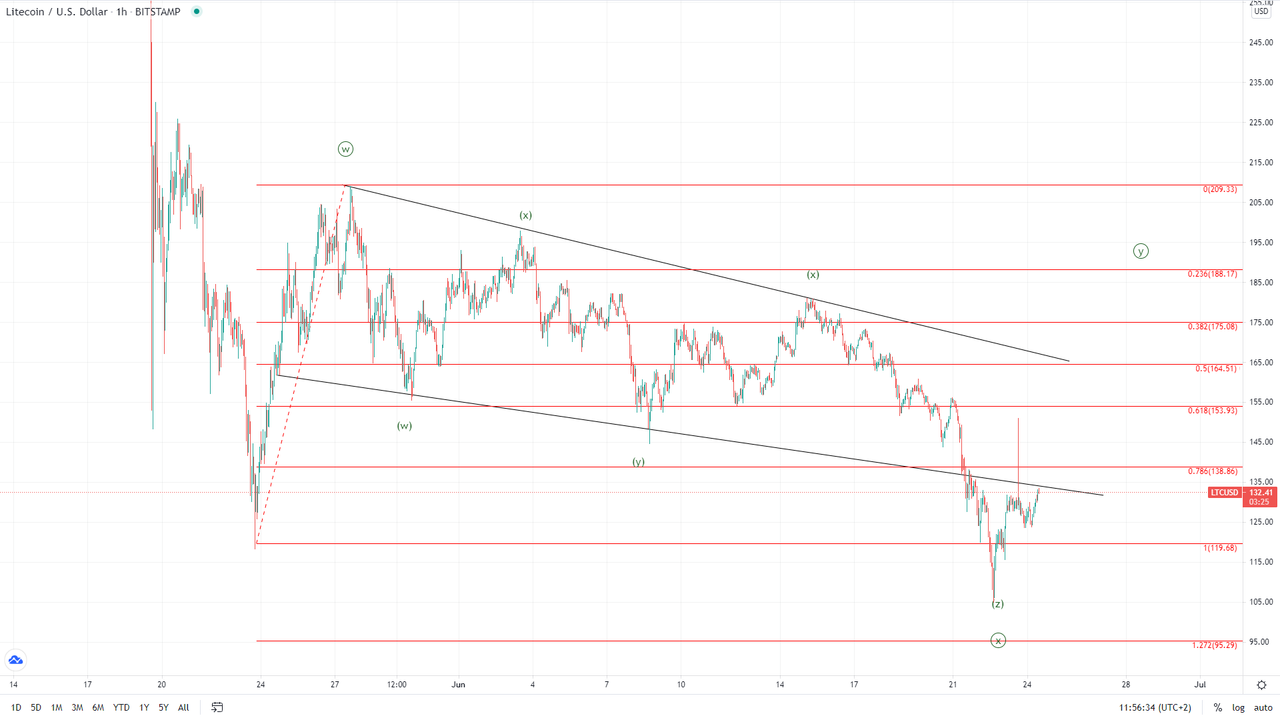
On the 4-hour chart, we can see that this is the third time the price has been trading on its lower level of the horizontal range that formed from the 23rd of May. But doing so it weakened the level which is why it potentially wonít hold for much longer. However, the wave structure implies that we might see a recovery shortly at least as the 2nd sub-wave of the next three-wave correction to the downside after which we could see a larger recovery.
From here a breakout to the downside isnít so likely but rather the price could now find another support here and bounce but only for a lower high compared to the one on the 15th of June. Another possibility would be that from the 8th till the 15th of June we have seen the 3rd wave out of the higher degree correction with its first wave being the upward move from the 23rd till the 26th of May. In that case, the price could continue its downside trajectory but also in the near term a move to the upside would now be expected.
Read Full on FXOpen Company Blog...


 LinkBack URL
 About LinkBacks


 Reply With Quote







Bookmarks