Page 18 of 146 FirstFirst ... 8 16 17 18 19 20 28 68 118 ... LastLast
Results 171 to 180 of 1456

Daily Market Analysis By FXOpen

This is a discussion on Daily Market Analysis By FXOpen within the Analytics and News forums, part of the Trading Forum category; EUR/USD and EUR/JPY: Euro Remains At Risk of More Downsides EUR/USD started a fresh decline and it settled below 1.1900. ...


  1. #171
    Junior Member FXOpen Trader's Avatar
    Join Date
    Dec 2020
    Location
    Asia
    Posts
    1,767
    EUR/USD and EUR/JPY: Euro Remains At Risk of More Downsides


    EUR/USD started a fresh decline and it settled below 1.1900. EUR/JPY is showing bearish signs and upsides are likely to remain limited above 131.00.

    Important Takeaways for EUR/USD and EUR/JPY

    • The Euro declined below the 1.1920 and 1.1900 support levels, and tested 1.1800.
    • There was a break below a short-term ascending channel with support near 1.1865 on the hourly chart.
    • EUR/JPY started a major decline after it failed to stay above the 131.50 support.
    • There is a key bearish trend line forming with resistance near 131.80 on the hourly chart.


    EUR/USD Technical Analysis

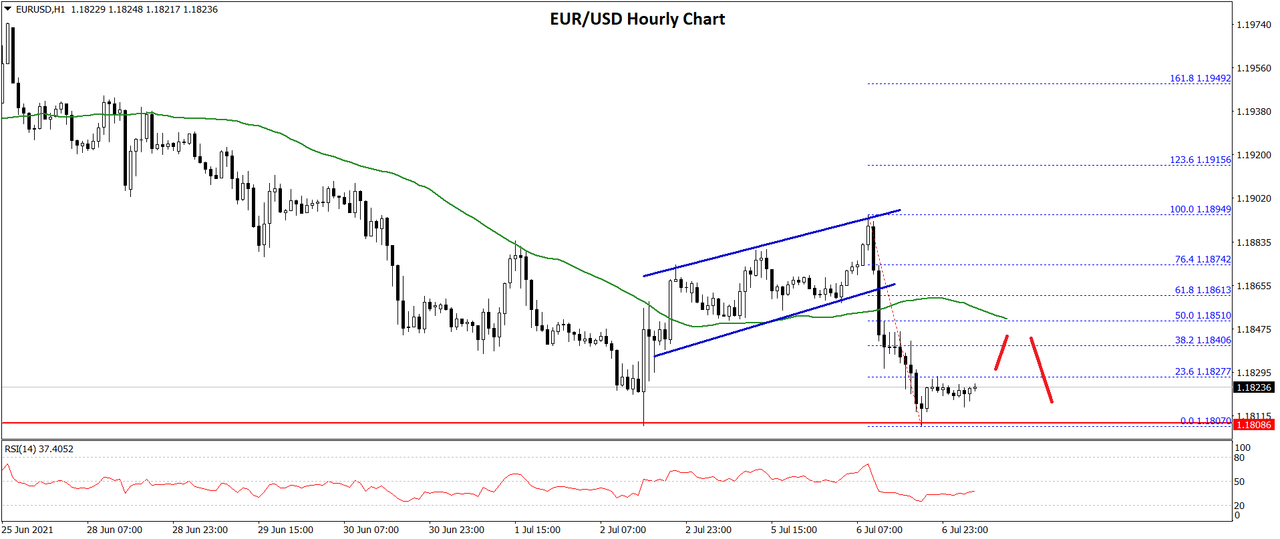
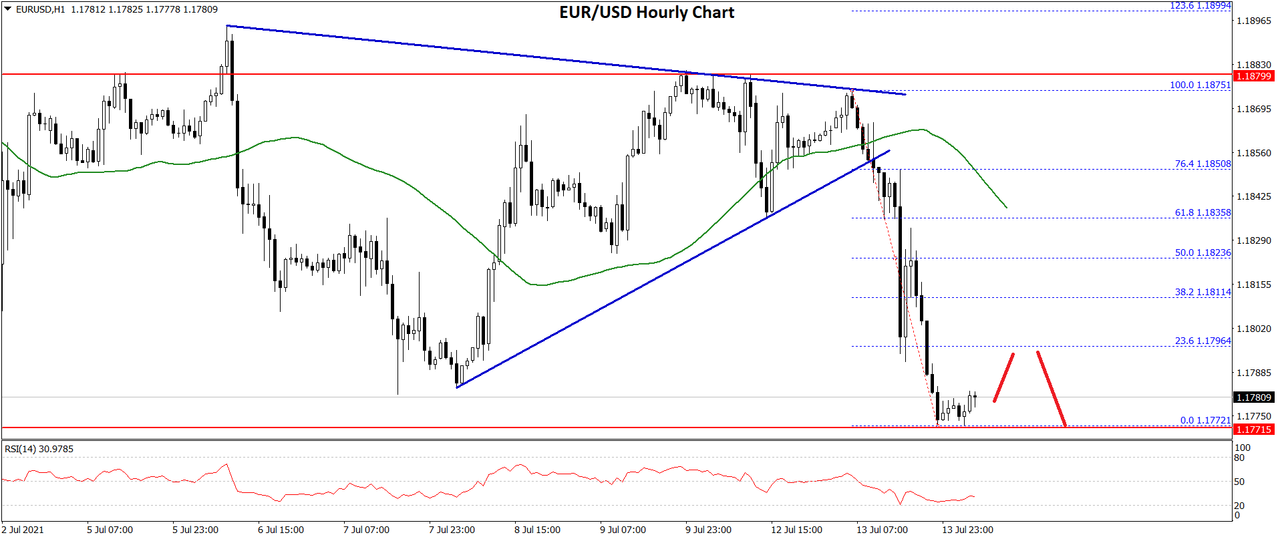
    The Euro started a fresh decline from the 1.2000 resistance zone against the US Dollar. The EUR/USD pair broke the 1.1920 and 1.1900 support levels to move into a bearish zone.

    The pair even settled well below 1.1900 and the 50 hourly simple moving average. Recently, there was a break below a short-term ascending channel with support near 1.1865 on the hourly chart.


    A low was formed near 1.1807 on FXOpen and the pair is now consolidating losses. An immediate resistance is near the 1.1828 level. It is near the 23.6% Fib retracement level of the recent decline from the 1.1894 high to 1.1807 low.

    The first major resistance is near the 1.1850 level. It is near the 50% Fib retracement level of the recent decline from the 1.1894 high to 1.1807 low.

    Any more gains could set the pace for a move towards the 1.1900 level. The next major resistance is near the 1.1950 level. On the downside, an immediate support is near the 1.1800 level.

    If there is a downside break, EUR/USD might continue to move down towards the 1.1760 support. Any more losses could open the doors for a test of the 1.1700 region. An intermediate support could be near the 1.1720 level.

    Read Full on FXOpen Company Blog...

  2. #172
    Junior Member FXOpen Trader's Avatar
    Join Date
    Dec 2020
    Location
    Asia
    Posts
    1,767
    LTC and EOS – Further lows expected


    LTC/USD

    The price of Litecoin reached $148 on the 4th of July which was the same level as on the prior high. From there we have seen the start of a descending move and is currently being traded at $130 and is still in a downward trajectory.


    On the hourly chart, you can see that the price broke out from the ascending support level from the 22nd of June. This is the first signal that the prior recovery ended and now we have seen the start of a descending move of the same degree as the one that lasted from the 22nd of June till the 4th of July.

    July 4th high came up to the descending trendline which is the upper level of the descending triangle which formed from the 23rd of May. As the price found resistance again this validated that the previous recovery was corrective in nature in conjunction with the wave structure. This is why it is counted as the 4th corrective wave with now most likely the 5th one to the downside developing.

    If this is true then we are to see a lower low compared to the one on the 22nd of June when the price of Litecoin fell to $105 area. If the descending triangle is still in play another third interaction with its support level could be seen which brings the price target to $90.

    Read Full on FXOpen Company Blog...

  3. #173
    Junior Member FXOpen Trader's Avatar
    Join Date
    Dec 2020
    Location
    Asia
    Posts
    1,767
    AUD/USD and NZD/USD Remain At Risk of More Downsides


    AUD/USD started a fresh decline from well above the 0.7550 level. NZD/USD also declined heavily and it even tested the 0.6920 support zone.

    Important Takeaways for AUD/USD and NZD/USD

    • The Aussie Dollar started a major decline after it failed to clear 0.7600 against the US Dollar.
    • There is a key bearish trend line forming with resistance near 0.7435 on the hourly chart of AUD/USD.
    • NZD/USD also started a major decline from well above the 0.7050 level.
    • There is a major bearish trend line forming with resistance near 0.6975 on the hourly chart of NZD/USD.


    AUD/USD Technical Analysis

    After struggling to clear the 0.7600 resistance, the Aussie Dollar started a major decline against the US Dollar. The AUD/USD pair broke the 0.7550 and 0.7520 support levels to move into a bearish zone.

    The pair even broke the 0.7480 support and the 50 hourly simple moving average. It spiked below 0.7420 and traded as low as 0.7409 on FXOpen. It is now consolidating losses above the 0.7400 level.


    An immediate resistance is near the 0.7430 level. It is near the 23.6% Fib retracement level of the recent decline from the 0.7533 swing high to 0.7409 low. There is also a key bearish trend line forming with resistance near 0.7435 on the hourly chart of AUD/USD.

    The next major resistance is near the 0.7465 level and the 50 hourly SMA. The 50% Fib retracement level of the recent decline from the 0.7533 swing high to 0.7409 low is also near the 0.7470 level.

    To move into a positive zone, the pair must settle above 0.7470 and the 50 hourly SMA. An initial support on the downside is near the 0.7410 level. The next major support is near the 0.7400 level. If there is a downside break below the 0.7400 support, the pair could extend its decline towards the 0.7350 level.

    Read Full on FXOpen Company Blog...

  4. #174
    Junior Member FXOpen Trader's Avatar
    Join Date
    Dec 2020
    Location
    Asia
    Posts
    1,767
    GBP/USD Recovers Ground, USD/CAD is Facing Uphill Task


    GBP/USD started a decent recovery wave from the 1.3750 support zone. USD/CAD must clear the 1.2500 resistance zone to continue higher in the near term.

    Important Takeaways for GBP/USD and USD/CAD

    • The British Pound started a fresh increase from the 1.3750 support zone.
    • There was a break above a key bearish trend line with resistance near 1.3775 on the hourly chart of GBP/USD.
    • USD/CAD gained bullish momentum above the 1.2450 and 1.2500 resistance levels.
    • There is a major bearish trend line forming with resistance near 1.2480 on the hourly chart.


    GBP/USD Technical Analysis

    The British Pound formed a strong support base above the 1.3750 level against the US Dollar. As a result, the GBP/USD pair started a decent increase and it broke many hurdles near 1.3800.


    There was a break above a key bearish trend line with resistance near 1.3775 on the hourly chart of GBP/USD. The pair gained pace above the 1.3820 level and the 50 hourly simple moving average.

    The pair even spiked above the 1.3900 resistance zone. A high is formed near 1.3909 on FXOpen and the pair is now consolidating gains. An initial support on the downside is near the 1.3875 level. It is near the 23.6% Fib retracement level of the upward move from the 1.3755 swing low to 1.3909 high.

    The main support is now forming near the 1.3830 level. It is close to the 50% Fib retracement level of the upward move from the 1.3755 swing low to 1.3909 high.

    On the upside, the pair must settle above the 1.3900 level. The next major resistance is near the 1.3940 level. Any more gains could lead the pair towards the 1.4000 barrier in the near term. An intermediate resistance could be 1.3980.

    Read Full on FXOpen Company Blog...

  5. #175
    Junior Member FXOpen Trader's Avatar
    Join Date
    Dec 2020
    Location
    Asia
    Posts
    1,767
    Bitcoin Gives Back Its 2021 Gains – What Next?


    Bitcoin started the year around $30,000, and now the level acts as support. The euphoria surrounding the cryptocurrency market ended with a 50% decline in the price of Bitcoin and, in some cases, with more.

    In the first quarter of the year, Tesla announced that it invested $1.5 billion into Bitcoin. Moreover, it said that it would accept payments for its vehicles in Bitcoin.

    The announcement led to massive buying into the crypto space as numerous altcoins entered the bullish territory. As such, Bitcoin rose from $30,000 to over $60,000.

    Investors viewed Tesla’s announcement as a sign of further adoption of the cryptocurrencies, thus the bullish run. However, a couple of months later, Tesla announced it had sold some of its Bitcoin holdings and booked a profit just before the end of the first quarter. In fact, the company made a profit on the quarter only from selling carbon credits and some of its Bitcoin holding.

    Shortly after the second quarter started, Tesla, through the voice of its CEO, Elon Musk, expressed its concerns about the energy use of mining Bitcoin. As such, it stopped accepting Bitcoin as payment for Tesla cars, but it is unclear if the company sold any of its remaining Bitcoin.


    Tesla Q2 Earnings – Key for Future Price Action in Bitcoin

    It is unclear if Tesla sold any of its remaining Bitcoin or not, but investors will find out pretty soon. The Q2 2021 earnings season starts now, and investors will look for clues about the company’s crypt holding. If Tesla sold more of its Bitcoin at the higher levels, the bias is that the market will test below $30,000.

    From a technical perspective, the market seems to have formed a head and shoulders pattern. Even the fact that the global Bitcoin mining energy use is comparatively negligible does not matter anymore, as the market is unable to bounce.

    Moreover, further investments from companies such as MicroStrategy, which announced over $1.5 billion invested in Bitcoin in the second quarter alone, were not enough to lift the price of Bitcoin.

    To sum up, if there is one critical event for Bitcoin in the weeks ahead, it is the Tesla Q2 2021 earnings. Any changes in the company’s crypto portfolio may move the market.

    FXOpen Blog

  6. #176
    Junior Member FXOpen Trader's Avatar
    Join Date
    Dec 2020
    Location
    Asia
    Posts
    1,767
    EUR/USD Remains At Risk, USD/CHF Eyes Larger Increase


    EUR/USD declined heavily below 1.1900 and it tested 1.1770. USD/CHF is rising and it could gain momentum if it manages to clear the 0.9200 resistance.

    Important Takeaways for EUR/USD and USD/CHF

    • The Euro started a fresh decline from well above the 1.1900 zone against the US Dollar.
    • There was a break below a major contracting triangle with support near 1.1855 on the hourly chart of EUR/USD.
    • USD/CHF started a fresh increase after it found support near 0.9123.
    • There was a break above a key bearish trend line with resistance near 0.9168 on the hourly chart.


    EUR/USD Technical Analysis

    The Euro struggled to gain pace above the 1.1900 level and it started a major decline against the US Dollar. As a result, the EUR/USD pair broke the 1.1850 support zone to move into a bearish zone.

    The pair even declined below the 1.1820 support zone and settled below the 50 hourly simple moving average. There was also a break below a major contracting triangle with support near 1.1855 on the hourly chart of EUR/USD.


    A low was formed near 1.1772 on FXOpen and the pair is now consolidating losses. An immediate resistance on the upside is near the 1.1795 level.

    It is near the 23.6% Fib retracement level of the recent drop from the 1.1875 high to 1.1772 low. If there is an upside break above the 1.1800 resistance zone, the price could recover steadily towards the 1.1825 resistance zone.

    The 50% Fib retracement level of the recent drop from the 1.1875 high to 1.1772 low is also near 1.1825. Any more gains might call for a test of 1.1850.

    On the downside, there is a major support forming near the 1.1770 zone. A downside break below the 1.1770 support could start another decline. The next major support could be near the 1.1710 level.

    Read Full on FXOpen Company Blog...

  7. #177
    Junior Member FXOpen Trader's Avatar
    Join Date
    Dec 2020
    Location
    Asia
    Posts
    1,767
    Crypto investors are looking for reasons to be optimistic


    The market has entered a consolidation zone after the anomalous activity of May 19, with fluctuations framed by a narrowing triangle formation. Currently, no significant news reports are affecting the market, and the volumes are fading. This situation is reminiscent of the calm before the storm. What will the storm be like and when will it happen?

    Optimists are looking for arguments that would signify a resuming growth. Analysts point to the outflow of bitcoins from cryptocurrency exchanges (see fig. 2), as evidenced by data (see fig. 1) collected by the Glassnode agency. Blue arrows on the chart indicate that previous outflows occurred against the backdrop of rising quotes. Therefore, the current outflow, according to analysts, could be a bullish harbinger.


    But digging deeper, we will find out that this was not always the case. A similar outflow occurred during the lull in the first half of November 2018. And in the second half, a bearish storm occurred, and BTCUSD collapsed from 6400 to 3200.

    Volume analysis does give cause for concern. On July 11, there was a growth attempt (see fig. 3), but the volumes were low, which indicates a possible shortage of buyers. The next day, July 12, confirms the weakness of demand, as the price decreased on growing volumes, which can be interpreted as active selling pressure. It seems that negative sentiment prevails in the market, as participants are actively selling the coin instead of buying. If so, then the price of 33,500 is too high for BTC.

    In such conditions, the fate of a psychological support level of 30k causes more and more concerns.

    FXOpen Blog

  8. #178
    Junior Member FXOpen Trader's Avatar
    Join Date
    Dec 2020
    Location
    Asia
    Posts
    1,767
    LTC and EOS – Upside expected but could be correctional


    LTC/USD

    The price of Litecoin was on the rise from yesterday and came up by 6% from its low of $124.3 to $131.8 at its highest point today. We have seen a minor pullback to $127.6 and currently it started moving to the upside again.


    On the hourly chart, you can see that yesterday’s low was the third lower low from the 29th of Jun. This could have marked the completion of the corrective ABC structure after a five-wave impulse from the 22nd of Jun. If this is true then the price is now set to continue moving to the upside in an impulsive manner.

    Another possibility could be that the price made a three-wave increase from the 22nd till the 29th in which case we have seen a corrective ABCDE after, but in both cases, the price would be expected to continue moving higher. Either as the continuation of the corrective WXY of the higher degree in a negative scenario or the 3rd wave from the five-wave impulse in a positive one.

    The pullback seen from yesterday is most likely the 2nd sub-wave of starting move to the upside so shortly a breakout would be expected from the descending resistance level and a higher high compared to yesterday’s one. Moving forward we are going to see from the price action which scenario is going to get validated.

    Read Full on FXOpen Company Blog...

  9. #179
    Junior Member FXOpen Trader's Avatar
    Join Date
    Dec 2020
    Location
    Asia
    Posts
    1,767
    Gold Price Could Extend Gains While Crude Oil Price Corrects Lower


    Gold price started a decent recovery wave above the $1,820 resistance. Crude oil price is declining and it might even break the $70.00 support zone.

    Important Takeaways for Gold and Oil

    • Gold price started a fresh recovery wave after forming a base above $1,790 against the US Dollar.
    • There is a key bullish trend line forming with support near $1,825 on the hourly chart of gold.
    • Crude oil price failed to settle above $75.000 and it started a fresh decline.
    • There was a break below a major bullish trend line with support near $74.55 on the hourly chart of XTI/USD.


    Gold Price Technical Analysis

    This week, gold price formed a decent support base above the $1,790 zone against the US Dollar. The price started a fresh upward move and it surpassed the $1,800 resistance zone.

    The price even settled above the $1,810 level and the 50 hourly simple moving average. The price even broke the $1,820 resistance and it traded as high as $1,833 on FXOpen. Recently, there was a minor downside correction below the $1,830 level.


    The price even traded below the 23.6% Fib retracement level of the upward move from the $1,791 low to $1,833 high. However, the bulls are protecting the $1,820 support.

    There is also a key bullish trend line forming with support near $1,825 on the hourly chart of gold. The 50 hourly SMA is also near the trend line. If there is a downside break, the price could test the $1,810 support.

    An intermediate support could be the 50% Fib retracement level of the upward move from the $1,791 low to $1,833 high at $1,812. An immediate resistance on the upside is near the $1,832 level.

    The first major resistance is near the $1,835 level. If the price breaks the $1,835 level, it could accelerate higher. In the stated case, the price could rise towards the $1,850 zone.

    Read Full on FXOpen Company Blog...

  10. #180
    Junior Member FXOpen Trader's Avatar
    Join Date
    Dec 2020
    Location
    Asia
    Posts
    1,767
    GBP/USD and EUR/GBP: British Pound Remains At Risk


    GBP/USD started a steady decline below the 1.3900 zone. EUR/GBP is rising and it might continue to rise if it breaks the 0.8600 resistance zone.

    Important Takeaways for GBP/USD and EUR/GBP

    • The British Pound failed to recover above the key 1.3900 resistance zone.
    • There is a major bearish trend line forming with resistance near 1.3855 on the hourly chart of GBP/USD.
    • EUR/GBP started a fresh increase after it found a strong support near the 0.8500 zone.
    • There was a break above a major bearish trend line with resistance near 0.8550 on the hourly chart.


    GBP/USD Technical Analysis

    The British Pound made many attempts to clear the 1.3900 and 1.3910 resistance levels against the US Dollar. The GBP/USD pair started a major decline and it settled below the 1.3850 pivot level.

    The pair even broke the 1.3800 support level and it settled below the 50 hourly simple moving average. The recent low was formed near 1.3746 and the pair is now showing a lot of bearish signs.


    An immediate resistance on the upside is near the 1.3775 level. The 23.6% Fib retracement level of the downward move from the 1.3861 swing high to 1.3746 low. The first major resistance is now forming near the 1.3800 zone.

    The 50% Fib retracement level of the downward move from the 1.3861 swing high to 1.3746 low is also near the 1.3800 zone. The next major resistance near the 1.3820 level and the 50 hourly simple moving average.

    There is also a major bearish trend line forming with resistance near 1.3855 on the hourly chart of GBP/USD. To move into a positive zone, the pair must clear the bearish trend line and then 1.3900.

    An immediate support on the downside is near the 1.3745 level. A downside break below the 1.3745 level might call for a fresh decline towards the 1.3700 level. Any more losses could lead the pair towards the 1.3650 level in the near term.

    Read Full on FXOpen Company Blog...

Page 18 of 146 FirstFirst ... 8 16 17 18 19 20 28 68 118 ... LastLast

Bookmarks

Posting Permissions

  • You may not post new threads
  • You may not post replies
  • You may not post attachments
  • You may not edit your posts
  •