
 LinkBack URL
 About LinkBacks


EUR/USD Could Recover, USD/JPY Eyes More Upsides
EUR/USD declined heavily to 1.0800 before it started an upside correction. USD/JPY surged above 115.50 and now consolidating gains.
Important Takeaways for EUR/USD and USD/JPY
- The Euro declined heavily below 1.1200 before it found support near 1.0800.
- There was a break above a key bearish trend line with resistance near 1.0900 on the hourly chart of EUR/USD.
- USD/JPY started a strong upward move above the 115.20 and 115.50 resistance levels.
- There is a major bullish trend line forming with support near 115.70 on the hourly chart.
EUR/USD Technical Analysis
This past week, the Euro started a major decline from well above 1.1200 against the US Dollar. The EUR/USD pair declined heavily below the 1.1120 support zone.
The pair even broke the 1.0980 level and settled below the 50 hourly simple moving average. A low was formed near 1.0805 on FXOpen and the pair is now correcting higher. There was a move above the 23.6% Fib retracement level of the key decline from the 1.1232 swing high to 1.0805 low.
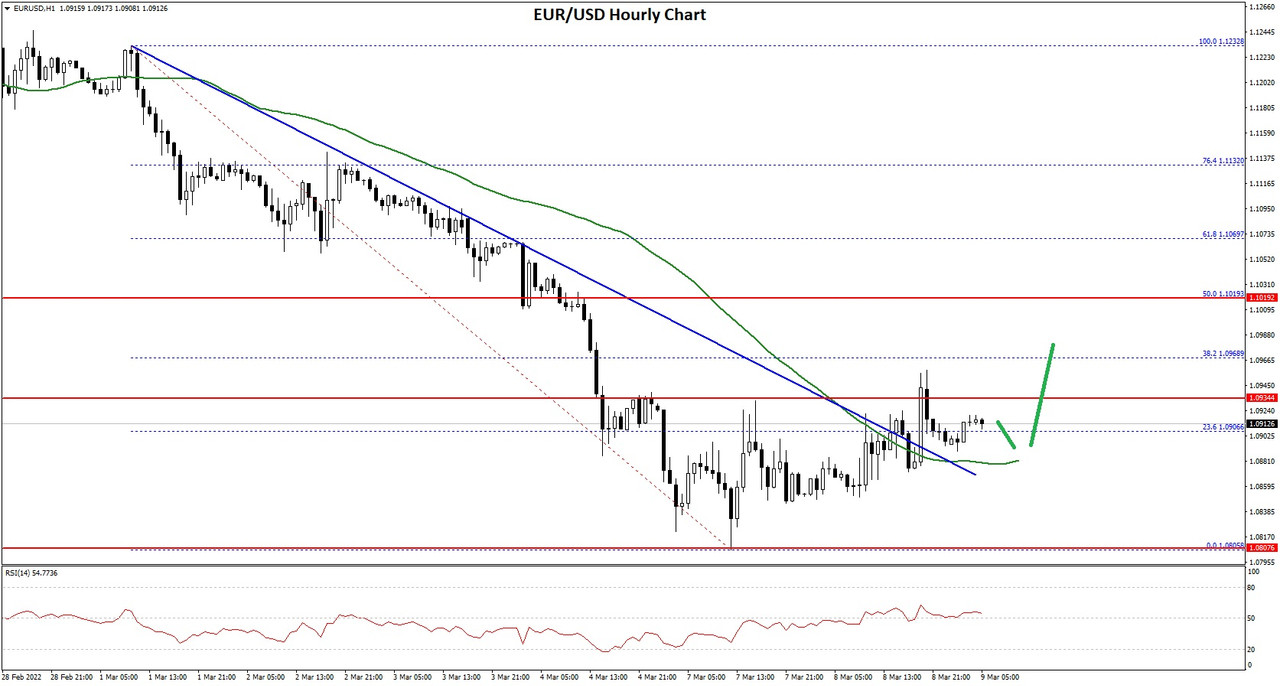
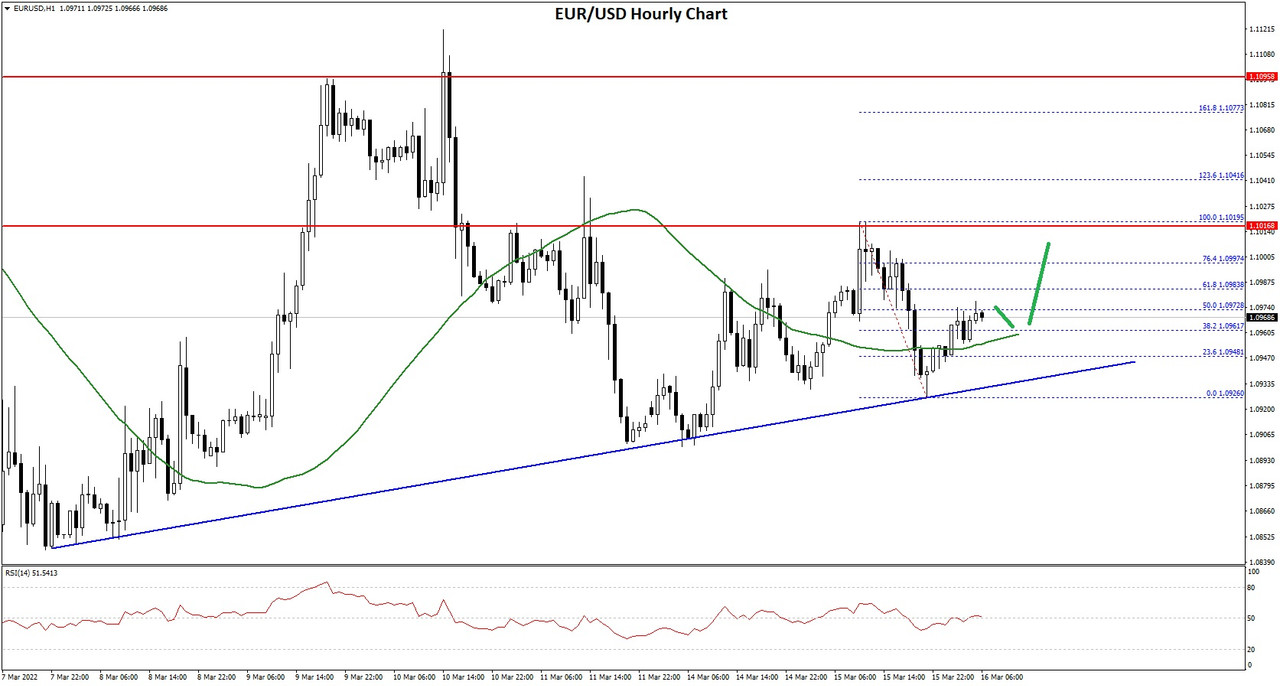
EUR/USD Hourly Chart
There was also a break above a key bearish trend line with resistance near 1.0900 on the hourly chart of EUR/USD. An immediate resistance on the upside is near the 1.0935 level.
The next major resistance is near the 1.0970 level. The main resistance is near the 1.1020 level. It is near the 50% Fib retracement level of the key decline from the 1.1232 swing high to 1.0805 low. An upside break above 1.1020 could set the pace for a steady increase.
If there is no break above 1.0935, the pair might start a fresh decline. An immediate support is near the 1.0880 and the 50 hourly simple moving average. The next major support is near 1.0820, below which the pair could drop to 1.0750 in the near term.
Read Full on FXOpen Company Blog...


 Reply With Quote


Bookmarks