
 LinkBack URL
 About LinkBacks


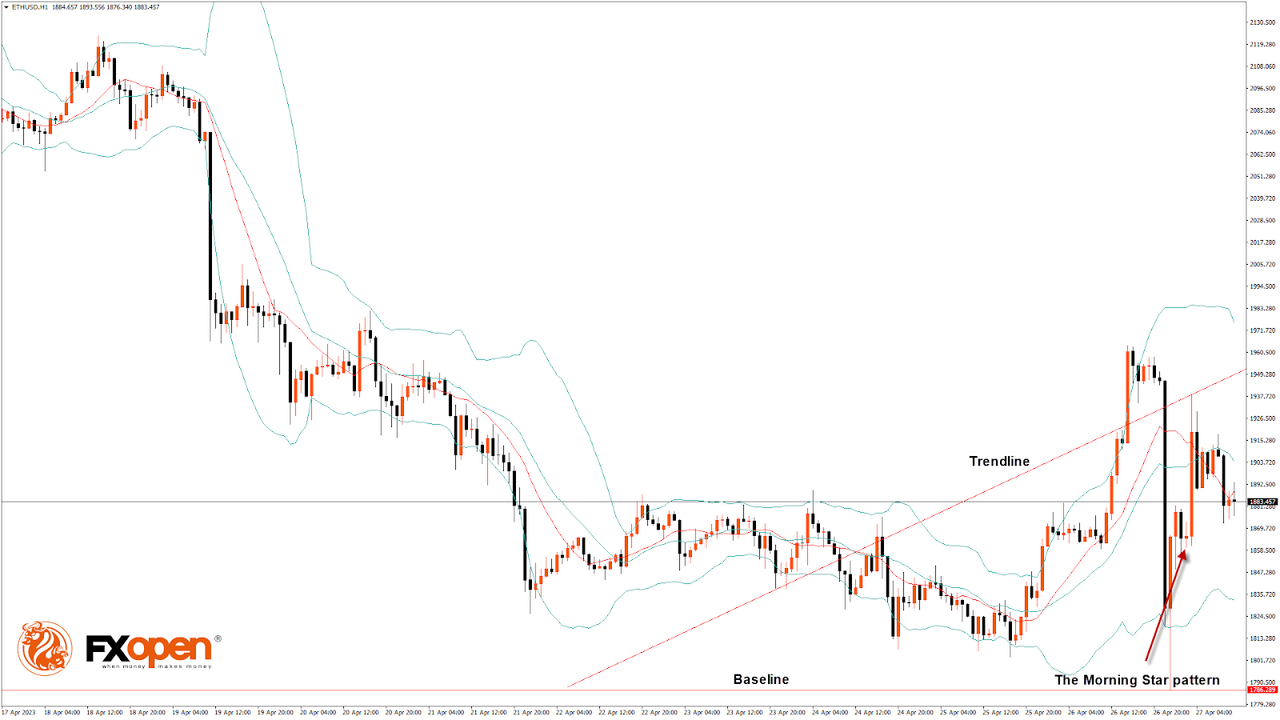
ETHUSD Analysis: The Morning Star Pattern above $1,786
Bulls were able to take control of the market, and after touching a low of $1,786 on 26 April, the ETH/USD pair is showing bullish momentum, touching a high of $1,938 today in the early Asian trading session.
ETHUSD is under mild bullish pressure after its decline below the $1,800 handle due to improved investor sentiment and support seen at lower levels.
The morning star pattern is above the $1,786 handle on the H1 timeframe. It's a bullish pattern, which signifies the end of a bearish phase.
The price is above the Ichimoku cloud in the 15-minutes timeframe.
ETH is back above the pivot point, indicating the bullish pressure in the market.
The relative strength index is at 57.13, indicating a strong demand for Ether and a continuation of the buying pressure in the market.
The STOCHRSI is giving neutral, meaning that the price is expected to enter into a consolidation zone in the short-term range.
We also detected the formation of the bullish trend reversal pattern with the 50-period moving average in the 15-minutes timeframe.
Most of the technical indicators are bullish. Most moving averages are bullish at the current market level of $1,885.
ETH is now trading above the 200-hour simple and 200-hour exponential moving averages.
- ETH bullish reversal is seen above the $1,786 mark.
- The short-term range is expected to be mildly bullish.
- The average true range indicates high market volatility.
VIEW FULL ANALYSIS VISIT - FXOpen Blog...
Disclaimer: This Forecast represents FXOpen Companies opinion only, it should not be construed as an offer, invitation or recommendation in respect to FXOpen Companies products and services or as Financial Advice.


 Reply With Quote


Bookmarks