
 LinkBack URL
 About LinkBacks


EUR/USD Eyes Upside Break While USD/CHF Consolidates Gains
EUR/USD is struggling to climb above the 0.9920 resistance zone. USD/CHF is consolidating gains above the 0.9950 support zone.
Important Takeaways for EUR/USD and USD/CHF
- The Euro started a fresh decline and traded below the 0.9950 zone against the US Dollar.
- There is a major bearish trend line forming with resistance near 0.9905 on the hourly chart of EUR/USD.
- USD/CHF started a fresh increase after it was able to clear the 0.9920 resistance.
- There is a key bullish trend line forming with support near 0.9950 on the hourly chart.
EUR/USD Technical Analysis
This past week, the Euro saw a major decline below the 0.9980 support against the US Dollar. The EUR/USD pair declined below the 0.9920 support level to move into a bearish zone.
The pair even tested the 0.9850 support zone. It is now forming a base above the 0.9850 level and is currently consolidating losses from the 0.9852 low formed on FXOpen. There was a minor recovery wave above the 0.9880 level.
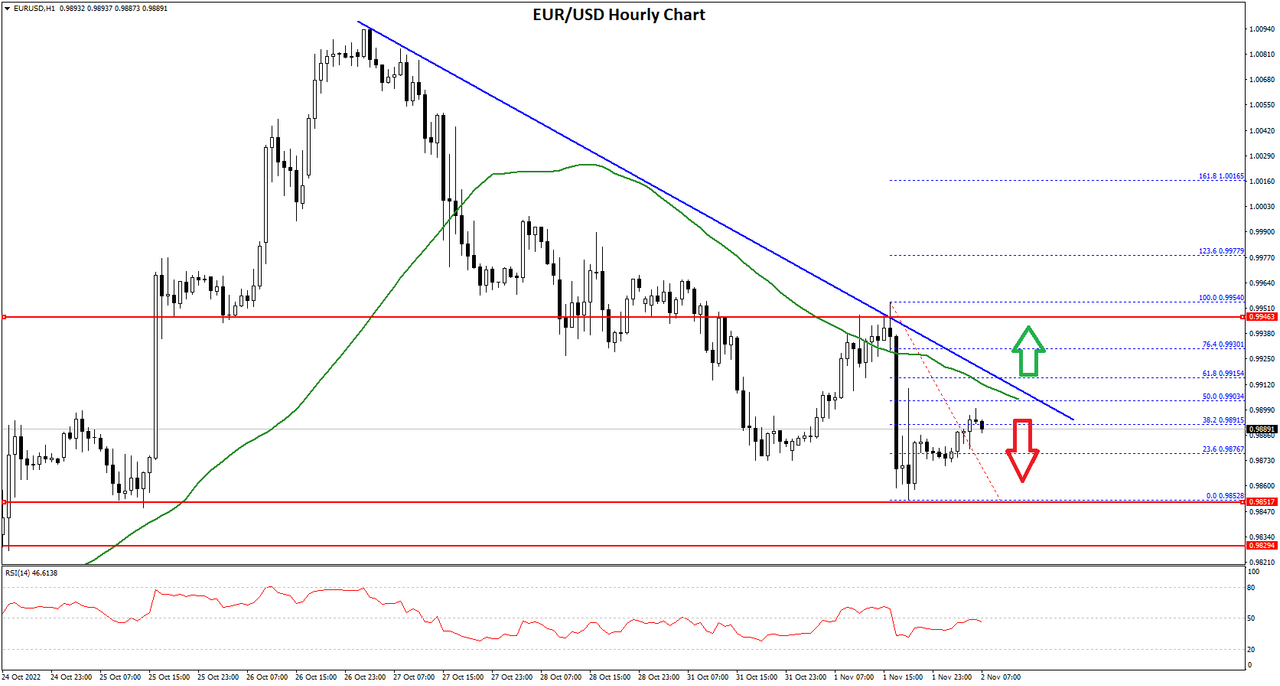
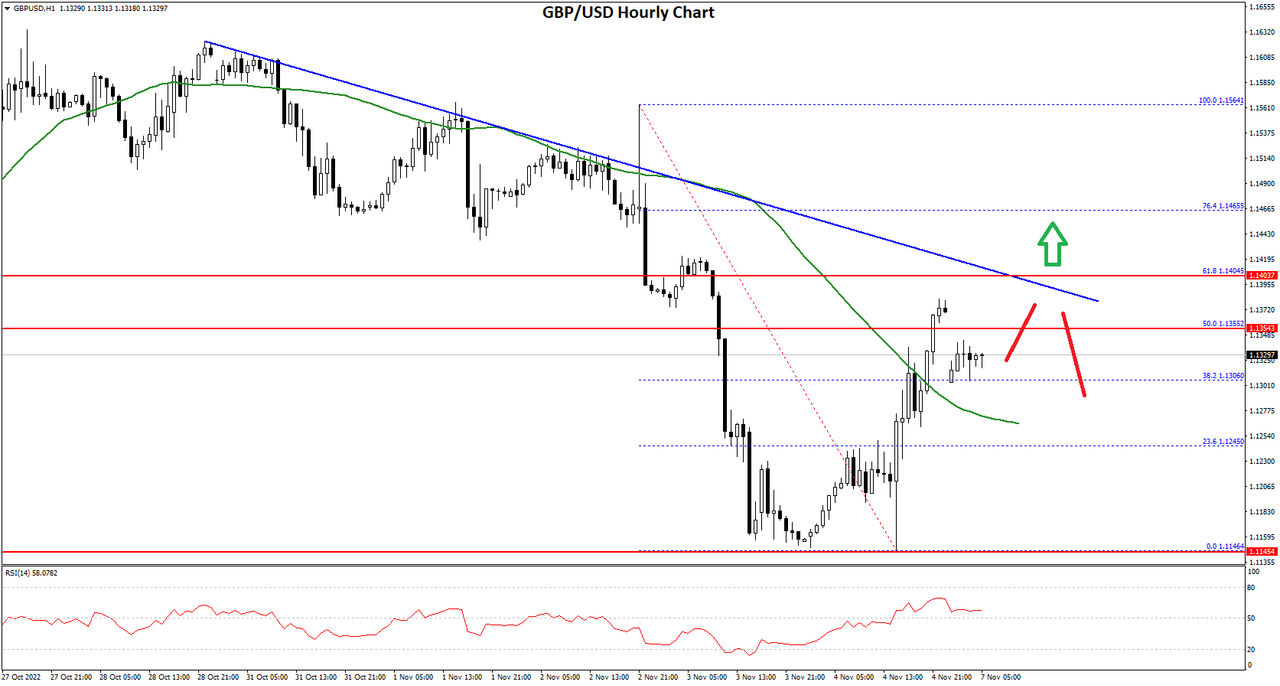
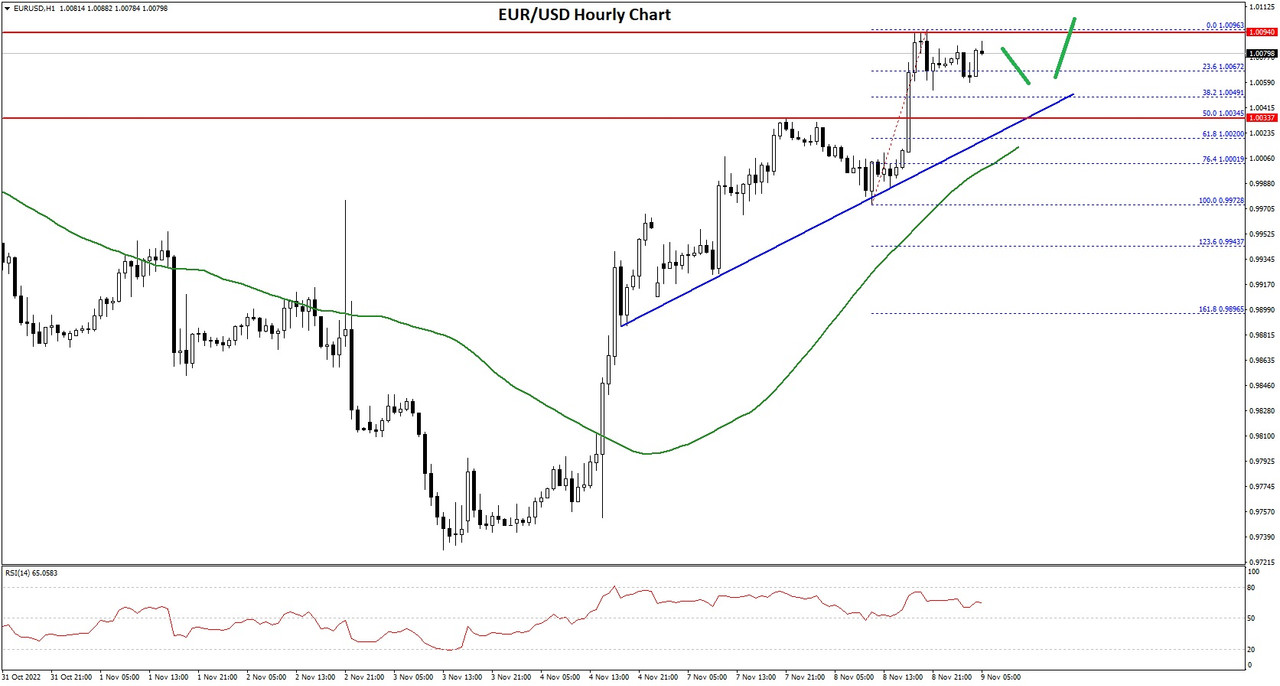
EUR/USD Hourly Chart
The pair climbed above the 23.6% Fib retracement level of the downward move from the 0.9954 swing high to 0.9852 low. An immediate resistance is near the 0.9900 level and the 50 hourly simple moving average.
There is also a major bearish trend line forming with resistance near 0.9905 on the hourly chart of EUR/USD. It is near the 50% Fib retracement level of the downward move from the 0.9954 swing high to 0.9852 low.
The next major resistance is near the 0.9920 level. A clear move above the 0.9920 resistance zone could set the pace for a larger increase towards 1.0000. The next major resistance is near the 1.0050 zone.
On the downside, an immediate support is near the 0.9865 level. The next major support is near the 0.9850 level. A downside break below the 0.9850 support could start another decline.
VIEW FULL ANALYSIS VISIT - FXOpen Blog...
Disclaimer: CFDs are complex instruments and come with a high risk of losing your money.


 Reply With Quote


Bookmarks