Page 73 of 146 FirstFirst ... 23 63 71 72 73 74 75 83 123 ... LastLast
Results 721 to 730 of 1456

Daily Market Analysis By FXOpen

This is a discussion on Daily Market Analysis By FXOpen within the Analytics and News forums, part of the Trading Forum category; Gold Price Faces Hurdles And Crude Oil Price Could Recover Steadily Gold price declined from the $1,850 resistance zone. Crude ...


  1. #721
    Junior Member FXOpen Trader's Avatar
    Join Date
    Dec 2020
    Location
    Asia
    Posts
    1,766
    Gold Price Faces Hurdles And Crude Oil Price Could Recover Steadily


    Gold price declined from the $1,850 resistance zone. Crude oil price is attempting a recovery wave above the $75.50 resistance zone.

    Important Takeaways for Gold and Oil

    • Gold price started a strong decline below the $1,832 level against the US Dollar.
    • A key bearish trend line is forming with resistance near $1,835 on the hourly chart of gold.
    • Crude oil price started a fresh increase from the $73.75 support zone.
    • There was a break above a major bearish trend line with resistance near $75.70 on the hourly chart of XTI/USD.


    Gold Price Technical Analysis

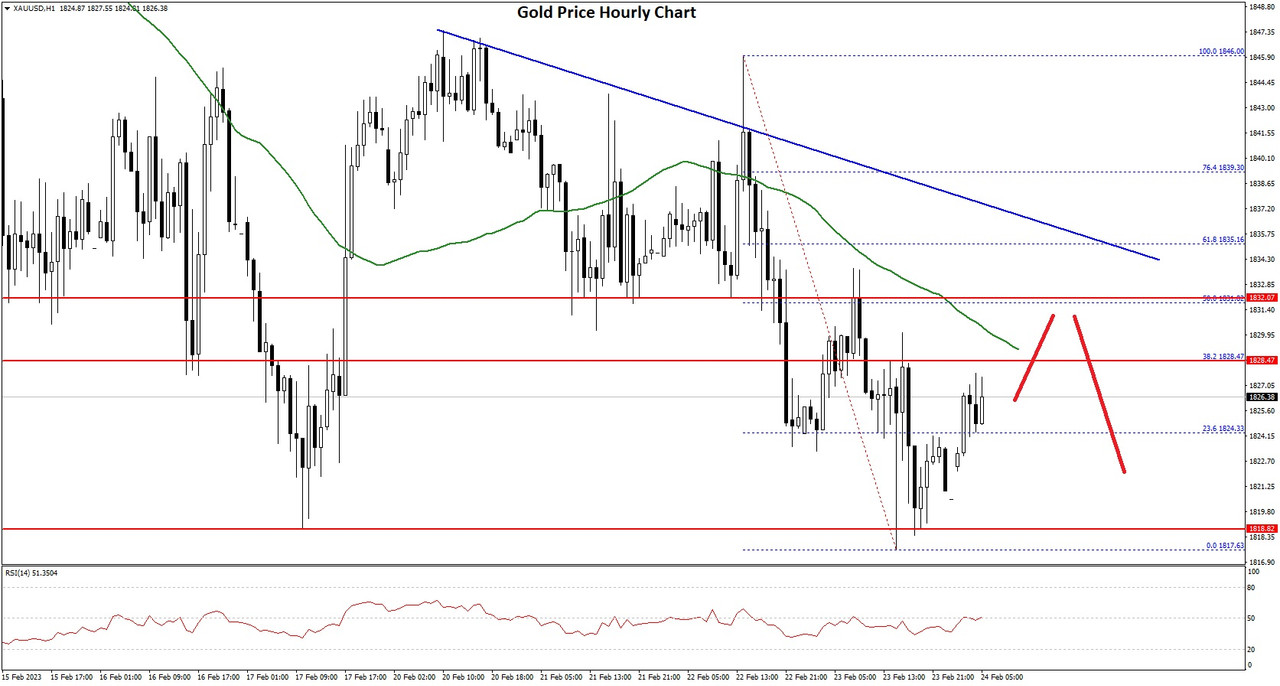
    Gold price struggled to clear the $1,850 resistance against the US Dollar. The price started a strong decline and traded below the $1,832 support zone.

    The bears even pushed the price below $1,825 and the 50 hourly simple moving average. The price traded below the $1,820 level. A low is formed near $1,817 on FXOpen and the price is now consolidating losses. On the upside, an immediate resistance is near the $1,828 level or the 50 hourly simple moving average.

    Gold Price Hourly Chart


    The stated level is near the 38.2% Fib retracement level of the downward move from the $1,846 swing high to $1,817 low. The next key hurdle is near the $1,832 level.

    There is also a key bearish trend line is forming with resistance near $1,835 on the hourly chart of gold. The trend line is near the 50% Fib retracement level of the downward move from the $1,846 swing high to $1,817 low.

    A clear upside break above the $1,835 resistance could send the price towards $1,850. If there is no upside break, the price might correct lower.

    An immediate support on the downside is near the $1,820 level. The next major support is near the $1,812 level, below which there is a risk of a larger decline. In the stated case, the price could decline sharply towards the $1,800 support zone.

    VIEW FULL ANALYSIS VISIT - FXOpen Blog...

    Disclaimer: This Forecast represents FXOpen Companies opinion only, it should not be construed as an offer, invitation or recommendation in respect to FXOpen Companies products and services or as Financial Advice.

  2. #722
    Junior Member FXOpen Trader's Avatar
    Join Date
    Dec 2020
    Location
    Asia
    Posts
    1,766
    Watch FXOpen's February 20 - 24 Weekly Market Wrap Video

    In this video, FXOpen UK COO Gary Thomson sums up the week’s happenings and discusses the most significant news reports.

    • Oil volatility in vogue once again as crude production set to decrease
    • 8,000 was a pipe dream for the FTSE 100... for now!
    • British pound suddenly jumps against euro and dollar in surprise revival
    • Minutes of the Fed meeting show determination to further increase the rate


    Watch our short and informative video, and stay updated with FXOpen.


    FXOpen YouTube


    Disclaimer: This forecast represents FXOpen Companies opinion only, it should not be construed as an offer, invitation or recommendation in respect to FXOpen Companies products and services or as financial advice.

    #fxopen #fxopenyoutube #fxopenuk #weeklyvideo

  3. #723
    Junior Member FXOpen Trader's Avatar
    Join Date
    Dec 2020
    Location
    Asia
    Posts
    1,766
    GBP/USD Declines Heavily While EUR/GBP Attempts Recovery


    GBP/USD started a fresh decline below the 1.2200 support zone. EUR/GBP is rising and trading above the 0.8920 support zone.

    Important Takeaways for GBP/USD and EUR/GBP

    • The British Pound started a fresh decline from the 1.2150 resistance against the US Dollar.
    • There is a major bearish trend line forming with resistance near 1.2000 on the hourly chart of GBP/USD.
    • EUR/GBP found support near 0.8780 and is currently recovering higher.
    • There is a key bullish trend line forming with support near 0.8805 on the hourly chart.


    GBP/USD Technical Analysis

    The British Pound started a major decline from the 1.2150 resistance zone against the US Dollar. The GBP/USD pair gained pace below the 1.2050 level to move into a bearish zone.

    There was a clear move below the 1.2000 level and the 50 hourly simple moving average. The bears even pumped the price below the 1.1950 level and a low is formed near 1.1928 on FXOpen. It is now consolidating losses and trading below the 1.2000 level.

    GBP/USD Hourly Chart


    On the upside, an initial resistance is near the 1.1985 level. It is near the 50% Fib retracement level of the downward move from the 1.2041 swing high to 1.1928 low.

    The first major resistance is near the 1.2000 level. There is also a major bearish trend line forming with resistance near 1.2000 on the hourly chart of GBP/USD. The trend line is near the 61.8% Fib retracement level of the downward move from the 1.2041 swing high to 1.1928 low.

    A clear move above the 1.2000 level could spark a decent increase. The next major resistance sits near the 1.2020 level. Any more gains might send the pair towards the 1.2100 resistance zone.

    On the downside, an initial support is near the 1.1925 level. The next major support is near the 1.1880 level. Any more losses could lead the pair towards the 1.1800 support zone.

    VIEW FULL ANALYSIS VISIT - FXOpen Blog...

    Disclaimer: This Forecast represents FXOpen Companies opinion only, it should not be construed as an offer, invitation or recommendation in respect to FXOpen Companies products and services or as Financial Advice.

  4. #724
    Junior Member FXOpen Trader's Avatar
    Join Date
    Dec 2020
    Location
    Asia
    Posts
    1,766
    Things are beginning to look up for the British Pound


    The British Pound, which for many years was a bastion of solidity, its position as the world's most valuable sovereign currency giving it a unique status among other majors, and its low volatility giving it a guilt-edged reputation for low volatility and dependable long term value.

    That all changed during the course of last year, when the combined result of the United Kingdom's exit from the European Union, one and a half years of lockdowns, and involvement in global geopolitical affairs along with a cost of living crisis which is now over a year long, resulted in the British Pound sliding down to very low points against the Euro and US Dollar over a period of several weeks.

    As 2023 began, this constant reduction in value began to subside and volatility began, with the Pound sometimes regaining ground against the Dollar and Euro despite the clear economic concerns about the recession-bound British economy.

    Today, a little more volatility has been demonstrated, and the Pound rose this morning quite noticeably against the US Dollar, going from 1.19 to the high 1.20 range within an hour of the London markets opening.

    This may be the result of a few interesting factors, one of which may be the Office of National Statistics (ONS) having released data that the value of total goods imports into the United Kingdom increased by £155.5 billion (32.3%) and the value of total goods exports increased by £66.2 billion (20.8%) in 2022 when compared with 2021, which is an interesting and confidence-inspiring metric considering 2022's poor economic outlook for the country.

    Perhaps the most pragmatic way to view this is that imports did grow, but that is compared to 2021 when supply chain restrictions and lockdowns impeded imports, and consumers were saving their money due to uncertainty about the reopening of the economy.

    Either way, this is a positive direction and the Pound is responding in line with it.

    Additionally, as London continues to be an international financial and economic powerhouse despite the woes in the rest of the country, global consultancy EY has released figures which forecast that London's economy is on track to expand 2.6 per cent each year between 2024 and 2026, pushing it to the top of the countrywide growth table.

    Perhaps it is fair to assume that if this is the case, London is continuing to expand its economy despite the struggles in the provincial areas, denoting two distinctly different economic structures in one country.

    London's standing as a global financial capital with the world's best infrastructure for Tier 1 trading bodes well for growth as international business is the backbone of the city's financial ecosystem, therefore an increase in the value of the Pound on the back of such a report is perhaps to be expected.

    Certainly despite London’s GDP being expected to undergo a minor slowdown, shrinking 0.2 per cent this year, also the lowest of any region, it is tipped to race past Britain’s average yearly growth of 2.1 per cent between 2024 and 2026.

    Therefore the analysis depicts volatility, and the national currency is echoing it very clearly.

    VIEW FULL ANALYSIS VISIT - FXOpen Blog...

    Disclaimer: This Forecast represents FXOpen Companies opinion only, it should not be construed as an offer, invitation or recommendation in respect to FXOpen Companies products and services or as Financial Advice.

  5. #725
    Junior Member FXOpen Trader's Avatar
    Join Date
    Dec 2020
    Location
    Asia
    Posts
    1,766
    BTCUSD and XRPUSD Technical Analysis – 28th FEB 2023


    BTCUSD: Bullish Doji Star Pattern Above $22796

    Bitcoin was unable to sustain its bearish momentum last week and after touching a low of $22796 on 25th Feb the prices started to correct upwards against the US dollar, touching a high of $23873 on 27th Feb.

    We have seen a bearish opening of the markets this week.

    We can clearly see a bullish Doji star pattern above the $22796 handle which is a bullish reversal pattern because it signifies the end of a downtrend and a shift towards an uptrend.

    Bitcoin touched an intraday high of 23557 in the Asian trading session, and an intraday low of 23214 in the European trading session today.

    We can see that the MACD indicator is back over zero in the weekly time frame indicating bullish trends.

    The price of bitcoin is ranging near horizontal support in the weekly time frame indicating a bullish trend.

    Both the STOCH and STOCHRSI are indicating Overbought levels which means that in the immediate short term, a decline in the prices is expected.

    The price of bitcoin is ranging near the support of the channel in the 15-minute time frame indicating a bullish scenario.

    The relative strength index is at 55.00 indicating a strong demand for bitcoin, and the continuation of the buying pressure in the markets.

    Bitcoin is now moving below its 100 hourly simple moving average and below its 100 hourly exponential moving averages.

    Most of the major technical indicators are giving a buy signal, which means that in the immediate short term, we are expecting targets of 24000 and 25500.

    The average true range is indicating less market volatility with a bullish momentum.

    • Bitcoin: bullish reversal seen above $22796.
    • The Williams percent range is giving an overbought signal.
    • The price is now trading just below its pivot level of $23729.
    • The short-term range is mildly BULLISH.


    Bitcoin: Bullish Reversal Seen Above $22796


    The price of bitcoin is now moving into a consolidation channel below the $23500 handle which also means that now we are preparing for the next upwards move in bitcoin towards the $25000 level.

    The commodity channel index indicator is giving an oversold signal which indicates a neutral tone in the markets.

    Some of the technical indicators are also giving a neutral tone present in the markets.

    Bitcoin has resumed its rising trend channel with a positive momentum that is building at levels above the $23110.

    The immediate short-term outlook for bitcoin is strongly bullish, the medium-term outlook has turned bullish, and the long-term outlook remains neutral under present market conditions.

    Bitcoin’s support zone is located at $22711 which is a 14-day RSI at 50% and at $22893 which is a 3-10 day MACD oscillator stalls.

    The price of BTCUSD is now facing its classic resistance level of 24948 and Fibonacci resistance level of 26119 after which the path towards 27000 will get cleared.

    In the last 24hrs, BTCUSD has increased by 0.58% by 135.92$ and has a 24hr trading volume of USD 22.280 billion. We can see a decrease of 2.34% in the trading volume as compared to yesterday, which appears to be normal.

    The Week Ahead

    We can see that the price of bitcoin is now almost 53% up against the lows formed in November 2022.

    The consolidation in the levels of bitcoin also indicates that the global investor sentiment continues to improve and will lead to the higher price of bitcoin in the month of March 2023.

    The daily RSI is printing at 50.79 which indicates a neutral demand for bitcoin and the continuation of the bullish phase present in the markets in the short-term range.

    We can see the formation of a bullish trend line from $22796 towards the $23989 level.

    The price of BTCUSD is now facing its resistance zone located at $24030 at which the price crosses 9-day moving average and $24095 which is a 14-3 day raw stochastic at 70%

    The weekly outlook is projected at $24500 with a consolidation zone of $24000.

    VIEW FULL ANALYSIS VISIT - FXOpen Blog...

    Disclaimer: This Forecast represents FXOpen Companies opinion only, it should not be construed as an offer, invitation or recommendation in respect to FXOpen Companies products and services or as Financial Advice.

  6. #726
    Junior Member FXOpen Trader's Avatar
    Join Date
    Dec 2020
    Location
    Asia
    Posts
    1,766
    EUR/USD Eyes Recovery While USD/JPY Remains In Uptrend


    EUR/USD is correcting higher from the 1.0520 zone. USD/JPY is also rising and might rally further above the 137.00 resistance.

    Important Takeaways for EUR/USD and USD/JPY

    • The Euro started an upside correction above the 1.0550 resistance zone.
    • There was a break above a key bearish trend line with resistance near 1.0570 on the hourly chart of EUR/USD.
    • USD/JPY is showing a lot of bullish signs above the 135.80 support zone.
    • There is a major bullish trend line forming with support near 135.80 on the hourly chart.


    EUR/USD Technical Analysis

    This past week, the Euro saw bearish moves below the 1.0600 support against the US Dollar. The EUR/USD pair even broke the 1.0580 support zone.

    The pair gained pace below the 1.0550 support zone and traded as low as 1.0532 on FXOpen. The pair started an upside correction and traded above the 1.0550 resistance. There was a clear move above the 1.0580 level.

    EUR/USD Hourly Chart


    Besides, there was a break above a key bearish trend line with resistance near 1.0570 on the hourly chart of EUR/USD. A high was formed near 1.0645 and the pair started a fresh decline. There was a clear move below the 1.0600 support zone, but the pair stayed above the 50 hourly simple moving average.

    There was a spike below the 61.8% Fib retracement level of the upward move from the 1.0532 swing low to 1.0645 high. It is now consolidating near the 1.0590 level.

    On the upside, an immediate resistance is near the 1.0600 level. The next major resistance is near the 1.0640 level. An upside break above 1.0640 could set the pace for another increase. In the stated case, the pair might visit 1.0700.

    Any more gains might send the pair towards 1.0750. If not, it could continue to move down. An initial support on the downside is near the 1.0570 level. The first major support is near the 1.0550 level.

    The main support sits near the 1.0535 zone, below which the pair could start a major decline. In the stated case, the pair might dive towards the 1.0450 support zone.

    VIEW FULL ANALYSIS VISIT - FXOpen Blog...

    Disclaimer: This Forecast represents FXOpen Companies opinion only, it should not be construed as an offer, invitation or recommendation in respect to FXOpen Companies products and services or as Financial Advice.

  7. #727
    Junior Member FXOpen Trader's Avatar
    Join Date
    Dec 2020
    Location
    Asia
    Posts
    1,766
    ETHUSD and LTCUSD Technical Analysis – 02nd MAR, 2023


    ETHUSD: Three White Soldiers Pattern Above $1558

    Ethereum was unable to sustain its bearish momentum and after touching a low of $1558 on 25th Feb, the prices started to correct upwards against the US dollar ranging above the $1640 handle today in the Asian trading session.

    The prices of Ethereum are ranging near a new record high of 1 month.

    The price of ETHUSD is back over the pivot point in the weekly time frame indicating a bullish scenario.

    We can clearly see a three white soldiers pattern above the $1558 handle which is a bullish pattern and signifies the end of a bearish phase and the start of a bullish phase in the markets.

    ETH is now trading just above its pivot level of 1645 and moving into a mildly bullish channel. The price of ETHUSD is now testing its classic resistance level of 1650 and Fibonacci resistance level of 1656 after which the path towards 1700 will get cleared.

    We can see the formation of the bullish harami pattern in the weekly timeframe.

    The relative strength index is at 52.40 indicating a neutral demand for Ether and a shift towards the consolidation phase in the markets.

    The commodity channel index, CCI, is giving a neutral signal, which means that the prices are expected to remain in a consolidation phase.

    Some of the technical indicators are giving a buy market signal.

    Most of the moving averages are giving a buy signal at the current market level of $1645.

    ETH is now trading above both the 100 hourly simple and 100 hourly exponential moving averages.

    • Ether: bullish reversal seen above the $1558 mark.
    • The short-term range appears to be mildly bullish.
    • ETH continues to remain above the $1640 level.
    • The average true range is indicating less market volatility.


    Ether: Bullish Reversal Seen Above $1558


    ETHUSD continues to consolidate its gains and is now moving above the $1600 handle with an upside focus of $1700 and $1800 levels.

    We can see the formation of the bullish trend reversal pattern with moving averages MA20 in the daily time frame.

    The resistance of the channel is broken in the 15-minute time frame indicating a bullish outlook present in the markets.

    ETHUSD touched an intraday high of 1677 in the Asian trading session and an intraday low of 1638 in the London trading session today.

    The key support levels to watch are $1593 which is a 14-day RSI at 40%, and at $1637 at which the price crosses 18-day moving average stalls.

    ETH has decreased by 0.73% with a price change of 12.10$ in the past 24hrs and has a trading volume of 6.909 billion USD.

    We can see a decrease of 11.89% in the total trading volume in the last 24 hrs which is due to the market consolidation.

    The Week Ahead

    ETH has retracted after touching a high of $1677, and after this consolidation phase gets over, we are looking to cross the $1700 handle.

    We can see the formation of a bullish ascending channel from $1558 towards the $1691 level.

    The immediate short-term outlook for Ether has turned mildly bullish, the medium-term outlook has turned bullish, and the long-term outlook for Ether is neutral in present market conditions.

    The resistance zone is located at $1686 which is a 14-3 day raw stochastic at 80% and at $1694 at which the price crosses 9-day moving average stalls.

    The weekly outlook is projected at $1750 with a consolidation zone of $1700.

    VIEW FULL ANALYSIS VISIT - FXOpen Blog...

    Disclaimer: This Forecast represents FXOpen Companies opinion only, it should not be construed as an offer, invitation or recommendation in respect to FXOpen Companies products and services or as Financial Advice.

  8. #728
    Junior Member FXOpen Trader's Avatar
    Join Date
    Dec 2020
    Location
    Asia
    Posts
    1,766
    AUD/USD Aims Recovery While NZD/USD Remains In Uptrend


    AUD/USD declined below the 0.6780 level before it found support near 0.6700. NZD/USD is rising and might aim a move above the 0.6250 resistance.

    Important Takeaways for AUD/USD and NZD/USD

    • The Aussie Dollar started a fresh decline from the 0.6840 resistance against the US Dollar.
    • There is a key bearish trend line forming with resistance near 0.6755 on the hourly chart of AUD/USD.
    • NZD/USD started a decent increase above the 0.6150 resistance zone.
    • There is a major bullish trend line forming with support near 0.6220 on the hourly chart of NZD/USD.


    AUD/USD Technical Analysis


    The Aussie Dollar started a major decline from the 0.6840 resistance zone against the US Dollar. The AUD/USD pair declined below the 0.6800 and 0.6780 level.

    The pair even moved below the 0.6750 level and the 50 hourly simple moving average. A low was formed near the 0.6706 on FXOpen and the pair is now recovering losses. The pair is now trading near the 0.6750 resistance zone and the 50 hourly simple moving average.

    AUD/USD Hourly Chart


    On the upside, the AUD/USD pair is facing resistance near the 0.6750 level. It is near the 50% Fib retracement level of the downward move from the 0.6783 swing high to 0.6706 low.

    The next major resistance is near the 0.6755 level. There is also a key bearish trend line forming with resistance near 0.6755 on the hourly chart of AUD/USD. The trend line is near the 61.8% Fib retracement level of the downward move from the 0.6783 swing high to 0.6706 low.

    A close above the 0.6755 level could start another steady increase in the near term. The next major resistance could be 0.6800.

    On the downside, an initial support is near the 0.6725 level. The next support could be the 0.6700 level. If there is a downside break below the 0.6700 support, the pair could extend its decline towards the 0.6665 level.

    VIEW FULL ANALYSIS VISIT - FXOpen Blog...

    Disclaimer: This Forecast represents FXOpen Companies opinion only, it should not be construed as an offer, invitation or recommendation in respect to FXOpen Companies products and services or as Financial Advice.

  9. #729
    Junior Member FXOpen Trader's Avatar
    Join Date
    Dec 2020
    Location
    Asia
    Posts
    1,766
    Watch FXOpen's February 27 - March 3 Weekly Market Wrap Video

    In this video, FXOpen UK COO Gary Thomson sums up the week’s happenings and discusses the most significant news reports.

    • US indices post worst week of 2023
    • SEC continues to put pressure on the crypto market
    • February removes the January positive
    • GBPUSD: Bearish pattern and CBR uncertainty


    Watch our short and informative video, and stay updated with FXOpen.


    FXOpen YouTube


    Disclaimer: This forecast represents FXOpen Companies opinion only, it should not be construed as an offer, invitation or recommendation in respect to FXOpen Companies products and services or as financial advice.

    #fxopen #fxopenyoutube #fxopenuk #weeklyvideo

  10. #730
    Junior Member FXOpen Trader's Avatar
    Join Date
    Dec 2020
    Location
    Asia
    Posts
    1,766
    GBP/USD Starts Recovery While USD/CAD Faces Key Resistance


    GBP/USD is correcting losses and trading above the 1.2000 zone. USD/CAD is struggling to clear the 1.3650 resistance zone.

    Important Takeaways for GBP/USD and USD/CAD

    • The British Pound started a decent recovery wave above the 1.2000 resistance zone.
    • There was a break above a key bearish trend line with resistance near 1.1965 on the hourly chart of GBP/USD.
    • USD/CAD is struggling below the 1.3640 and 1.3650 support levels.
    • There is a major bearish trend line forming with resistance near 1.3640 on the hourly chart.


    GBP/USD Technical Analysis

    The British Pound started a fresh decline from well above 1.2120 against the US Dollar. The GBP/USD pair gained bearish momentum after there was a break below the 1.2050 support.

    The pair even broke the 1.2000 support level and the 50 hourly simple moving average. The recent swing high was formed near 1.1925 on FXOpen before the price started an upside correction. There was a move above the 1.1980 level.

    GBP/USD Hourly Chart


    There was a break above a key bearish trend line with resistance near 1.1965 on the hourly chart of GBP/USD. Besides, there was a move above the 50% Fib retracement level of the downward move from the 1.2142 swing high to 1.1925 low.

    An immediate resistance is near the 1.2050 level. It is near the 61.8% Fib retracement level of the downward move from the 1.2142 swing high to 1.1925 low.

    The next major resistance is near the 1.2080 level. Any more gains could lead the pair towards the 1.2120 barrier in the near term. If not, the pair could move down and might break the 1.2000 support. The next major support is near 1.1980.

    If there is a downside break, GBP/USD might test the 1.1920 support. The next major support sits at 1.1850, where the bulls might take a stand.

    VIEW FULL ANALYSIS VISIT - FXOpen Blog...

    Disclaimer: This Forecast represents FXOpen Companies opinion only, it should not be construed as an offer, invitation or recommendation in respect to FXOpen Companies products and services or as Financial Advice.

Page 73 of 146 FirstFirst ... 23 63 71 72 73 74 75 83 123 ... LastLast

Bookmarks

Posting Permissions

  • You may not post new threads
  • You may not post replies
  • You may not post attachments
  • You may not edit your posts
  •