Page 55 of 164 FirstFirst ... 5 45 53 54 55 56 57 65 105 155 ... LastLast
Results 541 to 550 of 1633

Wave Analysis by InstaForex

This is a discussion on Wave Analysis by InstaForex within the Analytics and News forums, part of the Trading Forum category; Oil returned to production Euphoria over the proximity of the agreement between China and the United States to end the ...


  1. #541
    Senior Member InstaForex Gertrude's Avatar
    Join Date
    Sep 2015
    Posts
    1,885
    Oil returned to production

    Euphoria over the proximity of the agreement between China and the United States to end the trade war pulled up quotes of the Brent and WTI. Nevertheless, it was worth of Donald Trump to say that the issue of the rollback of import duties has not yet been resolved, China will notice an 11.5% increase in black gold imports in October, and Oman will declare at the OPEC+ meeting that the agreement on production cut would be extended in the previous volume, as the bulls in both varieties began to get nervous.

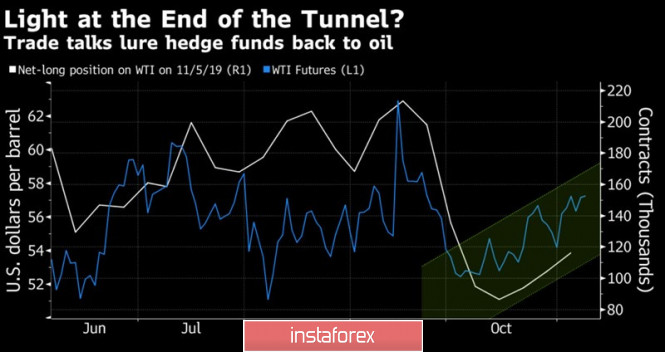
    As I noted in several previous materials, the slowdown in shale production in the United States, on the one hand, and the reduction in its volumes by Saudi Arabia, Russia, and other countries, on the other hand, have made the factor in changing global demand as the main driver of pricing. The slowdown in its growth under the influence of trade wars caused oil to fall from April to September, however, as soon as a turning point emerged in relations between Beijing and Washington, the situation changed radically. Speculators began to leave short positions and open long ones, and black gold added about 5% since the beginning of November.

    The dynamics of speculative positions and quotes WTI


    China is the largest oil consumer in the world, therefore, an increase in its imports in January-October by 10.5% YOY made it possible for investors to raise the logical question: if a trade war does not prevent China from increasing purchases of black gold, is it worth expecting that an agreement between Beijing and Washington will sharply raise prices? It is possible that most of the positive has already been incorporated into the Brent and WTI quotes, so the agreement under Phase 1 will go unnoticed by the players.

    Due to the prevailing principle of "buy by rumors, sell by facts" on the market, oil bulls may have problems after the OPEC+ signs an agreement on the extension of the Vienna agreement. It envisaged a decrease in production by 1.2 million bpd to March 2020. According to representatives of Oman, quotas will remain unchanged. Investors have no doubts about extending the terms of the agreement, so black gold can plunge into a wave of sales. Morgan Stanley believes that with such an outcome of the meeting between the cartel and Russia, prices for the North Sea grade will fall by 30% to $45 per barrel. Citigroup and BNP Paribas are afraid of the decline in Brent and WTI down to their lowest levels since the 1950s.

    Only one thing is obvious - the discussions will be hot. Saudi Arabia needs North Sea growth of $84 per barrel and more to finance its wasteful spending, and Iran with its US sanctions - and $195 per barrel altogether. Opponents of further cutting, most likely, will talk about the loss of OPEC+ market share.

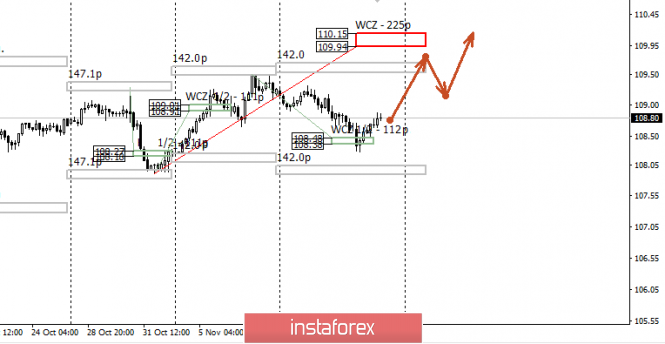
    Technically, a breakthrough of resistance at $62.6 and $63.6 (Pivot levels) will make it possible for the Brent bulls to continue the rally in the direction of the targets for the Wolfe Wave and Shark patterns. They are located near the marks of $72.1 and $73.8 per barrel. On the contrary, the inability of buyers to storm important levels will increase the risks of declining quotes to $59.3 and $56.3.

    Analysis are provided byInstaForex.
    Best regards, PR Manager
    Learn more about InstaForex Company at http://instaforex.com

  2. #542
    Senior Member InstaForex Gertrude's Avatar
    Join Date
    Sep 2015
    Posts
    1,885
    NZD / USD - change of priority

    Good evening, dear traders! A rather rare event has occurred today: the NZD rate has not been lowered, although all the data and forecasts have indicated otherwise. The market expected a rate cut by 0.25 basis points, and as a result, the RBNZ decided to leave it at the same level. Of course, the event was unexpected at the moment, and the market reacted bullish: the NZD/USD currency pair will end the current day with strong growth. Therefore, the recommendation for this instrument is attempts to take a long position (buy), but only from a pullback.

    Thus, I believe that on such a "positive" for the New Zealand currency, growth can be expected to continue from the morning impulse and the level of 0.6442 can be considered a possible target for growth - this is an important level for sellers who believe in this level as a resistance level. Now, after today's news, a very real prospect opens up to see at least a false breakdown of this level.


    The level of 0.6369 is considered to be an intermediate level for the pullback - it would be interesting to see the pullback as such in its area.

    I wish you all success in trading and great profits!

    Analysis are provided byInstaForex.
    Best regards, PR Manager
    Learn more about InstaForex Company at http://instaforex.com

  3. #543
    Member
    Join Date
    Sep 2015
    Posts
    94
    Forecast for EUR/USD on November 15, 2019


    On Thursday, due to new difficulties in relations between the United States and China (China is resisting the signing of a clearly unprofitable trade agreement for it), investors chose to close their positions due to the uncertain economic data for Europe and the US that are coming out today, right before strong technical support (1.0985). The price exceeded the MACD line, the Marlin oscillator showed a reversal, but these are not yet sufficient conditions for significant growth, the situation is typical for correction. With the return of the price under the MACD line, the next wave of activity in euro sales is likely. We do not expect a correction above the Fibonacci level of 123.6% (1.1073).


    On the four-hour chart, the Marlin signal line entered the growth zone, while the price remains below the MACD line. The exit of the price above the line (1.1035) will allow the euro to develop a correction. This can be prevented by economic indicators; The eurozone trade balance for September is expected today to fall from 20.3 billion euros to 18.7 billion, US retail sales are projected to grow by 0.1% in October from -0.3% in September. Concern is caused by industrial production in the US for October, the forecast is -0.4%.


    So, after the correction is over, we are waiting for a new round of euro decline. Overcoming the first support at 1.0985 opens the way to the second goal 1.0925.


    *The market analysis posted here is meant to increase your awareness, but not to give instructions to make a trade.

  4. #544
    Senior Member InstaForex Gertrude's Avatar
    Join Date
    Sep 2015
    Posts
    1,885
    Control zones USDJPY 11/18/19

    The pair tested the WCZ 1/2 108.48-108.38 last Thursday. Consolidation below the zone did not occur, therefore, the upward medium-term impulse remains a priority. The first growth target is the November high. Its achievement will make it possible to close part of the purchases and transfer the rest to breakeven.


    Closing Friday trades made it possible to form an absorption pattern of the daily level, which confirms the bullish momentum.

    Re-absorption of Friday purchases will be required to implement an alternative option. The probability of this is below 30%, which does not make it possible to consider sales. The main goal of the bullish impulse is the weekly control zone 110.15-109.94, which gives a favorable risk-to-profit ratio for any purchase made from current levels and below. Therefore, it is necessary to consider the possibility of adding to a long position.


    Daily CZ - daily control zone. The area formed by important data from the futures market, which change several times a year.

    Weekly CZ - weekly control zone. The zone formed by important marks of the futures market, which change several times a year.

    Monthly CZ - monthly control zone. The zone, which is a reflection of the average volatility over the past year.

    Analysis are provided byInstaForex.
    Best regards, PR Manager
    Learn more about InstaForex Company at http://instaforex.com

  5. #545
    Senior Member InstaForex Gertrude's Avatar
    Join Date
    Sep 2015
    Posts
    1,885
    Control zones USDJPY 11/18/19

    The pair tested the WCZ 1/2 108.48-108.38 last Thursday. Consolidation below the zone did not occur, therefore, the upward medium-term impulse remains a priority. The first growth target is the November high. Its achievement will make it possible to close part of the purchases and transfer the rest to breakeven.


    Closing Friday trades made it possible to form an absorption pattern of the daily level, which confirms the bullish momentum.

    Re-absorption of Friday purchases will be required to implement an alternative option. The probability of this is below 30%, which does not make it possible to consider sales. The main goal of the bullish impulse is the weekly control zone 110.15-109.94, which gives a favorable risk-to-profit ratio for any purchase made from current levels and below. Therefore, it is necessary to consider the possibility of adding to a long position.


    Daily CZ - daily control zone. The area formed by important data from the futures market, which change several times a year.

    Weekly CZ - weekly control zone. The zone formed by important marks of the futures market, which change several times a year.

    Monthly CZ - monthly control zone. The zone, which is a reflection of the average volatility over the past year.

    Analysis are provided byInstaForex.
    Best regards, PR Manager
    Learn more about InstaForex Company at http://instaforex.com

  6. #546
    Senior Member InstaForex Gertrude's Avatar
    Join Date
    Sep 2015
    Posts
    1,885
    Pound breaks the rules of the game

    The unwillingness of the Brexit Party to continue the struggle for seats in the renewed Parliament was the catalyst for the GBP/USD rally in the direction of the psychologically important mark of 1.3. In 2017, out of 43 seats now owned by Nigel Faraj's followers, 17 were held by the Conservatives, 11 by the Labour Party. The chances of the Tories' victory on December 12 are growing, and according to a poll by Bloomberg experts, their win will allow the pound to fly to $1.34. In such conditions, bulls will find it difficult not to fall into euphoria.

    According to a Savanta ComRes poll, the Conservative Party has a 10-point lead over the opposition Labour. Studies by Ipsos Mori showed that 25% of respondents believe in the Tory victory, a third of respondents believe that Boris Johnson's supporters will lead the coalition in the new Parliament. The prime minister himself claims that Conservatives will end the uncertainty that is hampering Britain's economy. Indeed, weaker GDP growth than Reuters experts expected, job cuts, inflation slowdowns and disappointing retail sales statistics indicate that Great Britain is in pain from market uncertainties.

    As a result, the 5% sterling rally for the last quarter runs counter to the principle of fundamental analysis "strong economy - strong currency". I would not be surprised if weak data on business activity in Britain lead to a continuation of the rally of the analyzed pair, because in this situation the chances of the Conservatives winning will increase.

    Theoretically, the volatility, growing like a yeast, should also exert pressure on the pound. Due to the volatility of quotes, GBP has often been called the "Great British Peso" recently, comparing it with the currencies of developing countries. In fact, the current level of volatility suggests that after a month the sterling will either rise to $1.32, or fall to $1.25. The first option seems more plausible than the second. Pound Volatility Dynamics


    The pound is able to restore the bullish trend before December, however, to begin with, it needs to be tested by the publication of the minutes of the October FOMC meeting and political debate. In his speeches at a press conference following the Federal Reserve meeting and before the US Congress, Jerome Powell put a high barrier to changing the rate on federal funds. Its current level of 1.75% is considered by the central bank as comfortable, and reduction is possible only in two cases: with the escalation of the trade conflict in Washington and Beijing and with a significant and prolonged deterioration of US macroeconomic statistics. As a result, the derivatives market believes that before the fall of 2020, changes in the monetary policy of the Fed should not be expected. If the minutes of the October FOMC meeting confirms this, the US dollar may receive some preferences.

    Technically, the GBP/USD update of the October highs will increase the risks of continuing the upward campaign to the area of 1,322-1,327, where the Bat and AB = CD targets are located, as well as the Pivot levels. While sterling is trading above $1.2725-1.275, the situation is under the control of the bulls.

    Analysis are provided byInstaForex.
    Best regards, PR Manager
    Learn more about InstaForex Company at http://instaforex.com

  7. #547
    Senior Member InstaForex Gertrude's Avatar
    Join Date
    Sep 2015
    Posts
    1,885
    #USDX vs AUD / USD vs NZD / USD vs USD / CAD - H4. Comprehensive analysis of movement options for November 20, 2019 APLs & ZUP analysis

    Minuette operational scale (H4) Commodity currencies - Here's a comprehensive analysis of the options for the development of the movement #USDX vs AUD / USD vs NZD / USD vs USD / CAD for November 20, 2019 on the Minuette operational scale forks (H4 time frame)

    ____________________

    US dollar Index

    The dollar index continues to remain in the 1/2 Median Line channel (97.65 - 97.92 - 98.15) of the Minuette operational scale forks, respectively, the further development of the #USDX movement from November 20, 2019 will be determined by the development and direction of the breakdown of the above levels. The details of the development are shown on animated chart.

    The breakdown of the lower boundary of the 1/2 Median Line channel (support level of 97.65) of the Minuette operational scale forks - continuation of the downward movement #USDX to the equilibrium zone (97.40 - 97.15 - 96.92) of the Minuette operational scale forks.

    On the contrary, in case of breakdown of the upper boundary of the 1/2 Median Line Minuette channel (resistance level of 98.15), the movement of the dollar index can be continued towards the goals: control line UTL (98.27) of the Minuette operational scale forks

    - local maximum 98.45 - lower boundary of the ISL38.2 (98.50) equilibrium zone of the Minuette operational scale forks - 1/2 Median Line Minuette (98.87).

    The markup of #USDX movement options from November 20, 2019 is shown on the animated chart.


    ____________________

    Australian dollar vs US dollar

    The development of the movement of the Australian dollar AUD / USD from November 20, 2019 will depend on the development and direction of the breakdown of the boundaries of the 1/2 Median Line channel (0.6812 - 0.6825 - 0.6842) of the Minuette operational scale forks. The details of the development of the boundaries of this channel are presented on the animated chart.

    The breakdown of the resistance level of 0.6842 at the upper boundary of the 1/2 Median Line Minuette channel is the continuation of the movement of the Australian dollar to the upper boundary of the 1/2 Median Line channel (0.6855) of the Minuette operational scale forks and the equilibrium zone (0.6865 - 0.6890 - 0.6915) of the Minuette operational scale forks.

    However, in the event of a breakdown of the lower boundary of the 1/2 Median Line channel (support level of 0.6812) on the Minuette operational scale, it will be possible to continue the downward movement of AUD / USD to the targets: the initial SSL Minuette line (0.6785) - local minimum 0.6770 - LTL Minuette control line (0.6760) - upper boundary ISL38.2 (0.6745) of the equilibrium zone of the Minuette operational scale forks.

    From November 20, 2019, we look at the layout of the AUD / USD movement options on the animated chart.


    ____________________

    New Zealand dollar vs US dollar

    From November 20, 2019, the development of the movement of the New Zealand dollar NZD / USD will be determined by the development and the direction of the breakdown of the range :

    resistance level of 0.6415 on the control line UTLof the Minuette operational scale forks;
    support level of 0.6395 at the upper boundary of the 1/2 Median Line channel of the Minuette operational scale forks.

    The breakdown of the UTL control line (resistance level of 0.6415) of the Minuette operational scale fork will determine the continuation of the development of the upward movement of NZD / USD to the equilibrium zone (0.6450 - 0.6475 - 0.6500) of the Minuette operational scale fork.

    In contrast, the breakdown of support level of 0.6395 will cause the movement of the New Zealand dollar to continue in the 1/2 Median Line channel (0.6395 - 0.6380 - 0.6360) of the Minuette operational scale forks, and if the breakdown of the lower boundary (0.6360) of this channel takes place, then the downward movement of this currency instrument can continue goals: local minimums (0.6330 - 0.6318) - control line LTL Minuette (0.6300) - 1/2 Median Line channel (0.6275 - 0.6230 - 0.6185) of the Minuette operational scale forks.

    From November 20, 2019, we look at the layout of the NZD / USD movement options on the animated chart.


    ____________________

    US dollar vs Canadian dollar

    Similarly, the development of the movement of the Canadian dollar USD / CAD from November 20, 2019 will also be due to the development and direction of the breakdown of the range :

    resistance level of 1.3210 at the lower boundary of ISL38.2 equilibrium zone of the Minuette operational scale forks;
    support level of 1.3200 at the upper boundary of the ISL38.2 equilibrium zone of the Minuette operational scale forks.

    The breakdown of ISL38.2 Minuette (support level of 1.3200) will make the development of the Canadian dollar to continue in the equilibrium zone (1.3200 - 1.3180 - 1.3160) of the Minuette operational scale forks followed by the continuation thereof in the 1/2 Median Line channel (1.3160 - 1.3130 - 1.3100) of the Minuette operational scale forks.

    On the contrary, the breakdown of ISL38.2 Minuette (resistance level of 1.3210) - the development of the USD / CAD movement in the equilibrium zone (1.3210 - 1.3252 - 1.3295) of the Minuette operational scale forks, taking into account the development of the SSL initial line (1.3262) of the Minuette operational scale forks and the local maximum 1.3270.

    From November 20, 2019, we look at the markup of the USD / CAD movement options on the animated chart.


    ____________________

    The review is made without taking into account the news background. Thus, the opening of trading sessions of major financial centers does not serve as a guide to action (placing orders " sell " or " buy ")

    The formula for calculating the dollar index:

    USDX = 50.14348112 * USDEUR0.576 * USDJPY0.136 * USDGBP0.119 * USDCAD0.091 * USDSEK0.042 * USDCHF0.036.
    where the power coefficients correspond to the weights of the currencies in the basket:
    Euro - 57.6%;
    Yen - 13.6%;
    Pound Sterling - 11.9%;
    Canadian dollar - 9.1%;
    Swedish Krona - 4.2%;
    Swiss franc - 3.6%.

    The first coefficient in the formula leads the index to 100 at the start date of the countdown - March 1973, when the main currencies began to be freely quoted relative to each other.

    Analysis are provided byInstaForex.
    Best regards, PR Manager
    Learn more about InstaForex Company at http://instaforex.com

  8. #548
    Senior Member InstaForex Gertrude's Avatar
    Join Date
    Sep 2015
    Posts
    1,885
    Trading idea for the AUD/USD pair

    Good evening, dear traders! The growth of AUD / USD is what is interesting today. As we remember, unemployment data was published in Australia last week on November 14, to which this instrument reacted negatively: the AUD/USD currency pair was declining throughout the whole day. An important detail is that during the fall, an important extreme at 0.6810 was updated. Thus, I believe that this was a culmination of the downward trend in November, and given the reaction of the Australian dollar to this week's news, I think that local growth is possible to the level of 0.6843, which is the news' high on Wednesday. Now, why exactly this level? It's simple - every seller who believes in a further fall of this instrument will clearly depend precisely on the news impulse on November 14, so the price can go there with a high degree of probability.

    [IMG]https://forex-images.ifxdb.com/userfiles/20191121/analytics5dd5cf772d1f3.png
    [/IMG]

    Recommendation: try to buy in order to update the level of 0.6943. At the same time, losses can be limited to the lowest level of 0.6788 - there is no sense in holding purchases below, and in case of updating this minimum, the bullish scenario can be considered invalid.

    Wishing you all success in trading and huge profits!

    Analysis are provided byInstaForex.
    Best regards, PR Manager
    Learn more about InstaForex Company at http://instaforex.com

  9. #549
    Member
    Join Date
    Sep 2015
    Posts
    94
    GBP/USD approaching support, potential bounce!


    Price is approaching our first support where we are expecting a bounce above this level.

    Entry: 1.28978

    38.2% Fibonacci retracement, 78.6% Fibonacci extension, horizontal overlap support

    Take Profit : 1.29731

    Why it's good : 78.6% Fibonacci retracement, horizontal swing high resistance


    *The market analysis posted here is meant to increase your awareness, but not to give instructions to make a trade.

  10. #550
    Senior Member InstaForex Gertrude's Avatar
    Join Date
    Sep 2015
    Posts
    1,885
    GBP/USD approaching resistance, potential drop!


    Price is approaching our first resistance a 1.28722 where we are expecting a drop to our first support level at 1.27697.

    Entry: 1.28722
    23.6% Fibonacci retracement, 61.8% Fibonacci extension, horizontal overlap resistance
    Take Profit : 1.27697
    Why it's good : horizontal swing low support

    Analysis are provided byInstaForex.
    Best regards, PR Manager
    Learn more about InstaForex Company at http://instaforex.com

Page 55 of 164 FirstFirst ... 5 45 53 54 55 56 57 65 105 155 ... LastLast

Tags for this Thread

Bookmarks

Posting Permissions

  • You may not post new threads
  • You may not post replies
  • You may not post attachments
  • You may not edit your posts
  •