Page 80 of 164 FirstFirst ... 30 70 78 79 80 81 82 90 130 ... LastLast
Results 791 to 800 of 1634

Wave Analysis by InstaForex

This is a discussion on Wave Analysis by InstaForex within the Analytics and News forums, part of the Trading Forum category; Forecast for EUR/USD on November 10, 2020 EUR/USD The euro did not beat around the bush and decided to strengthen ...


  1. #791
    Senior Member InstaForex Gertrude's Avatar
    Join Date
    Sep 2015
    Posts
    1,885
    Forecast for EUR/USD on November 10, 2020

    EUR/USD
    The euro did not beat around the bush and decided to strengthen the correction, as it looked into the collapse of gold (-4.51%) and silver (-6.90%)n. The euro has lost 62 points since Friday's close.


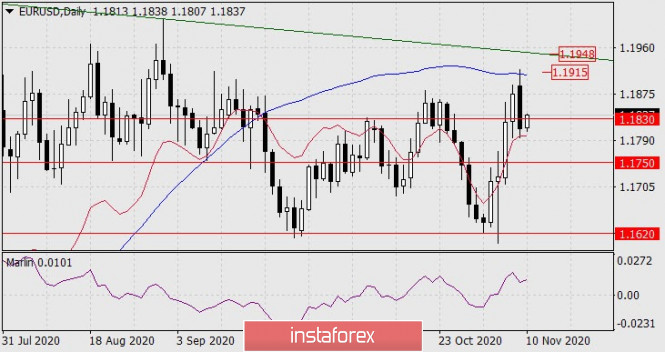
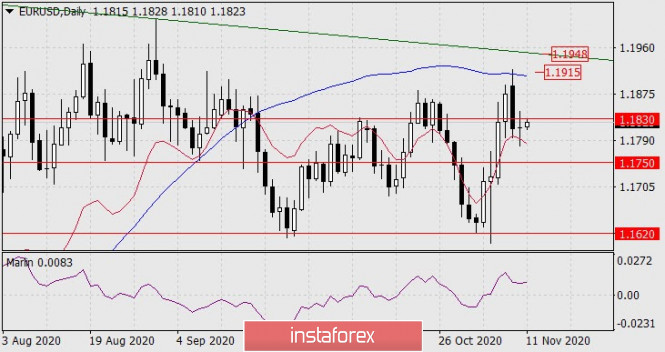
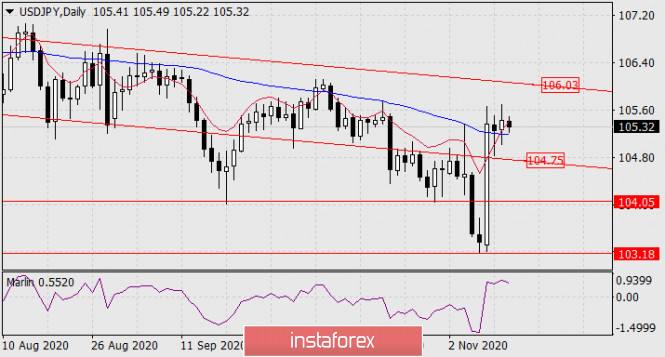
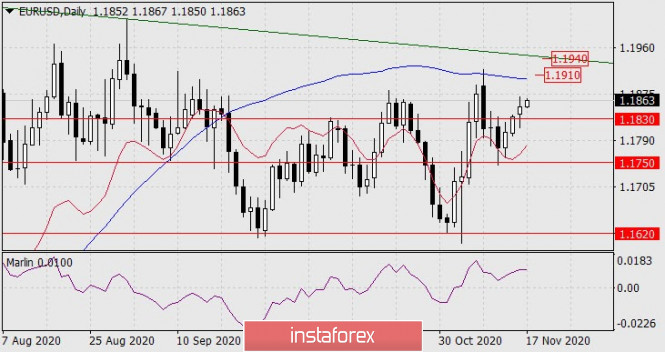
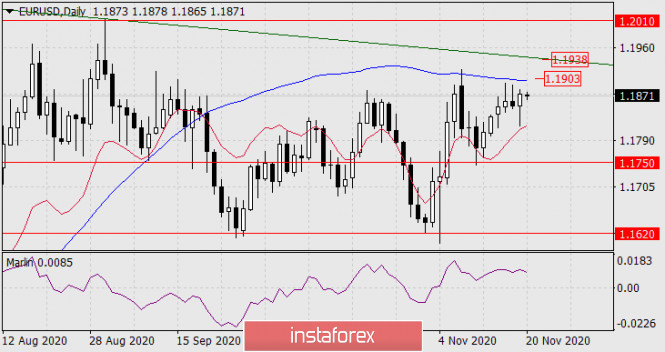
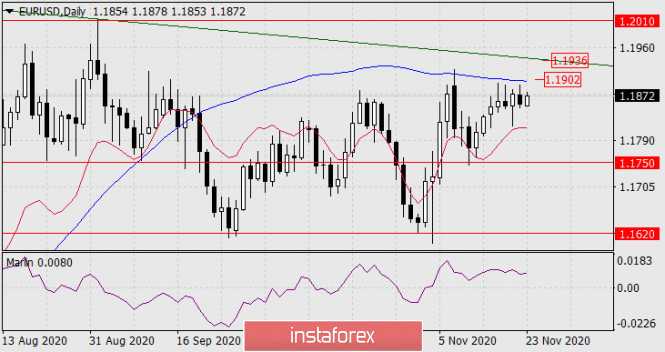
    The price touched the upper shadow of the MACD line and decisively reversed from it on the daily chart. Now the price needs to fall below the balance indicator line, since it will be easier for the price to drop in this case. The Marlin oscillator is moving down, but is also staying in the growth trend zone, the market has not cooled down after last week's growth, a second attempt to attack the MACD line in the 1.1915 area and further, towards the price channel line in the 1.1948 area.


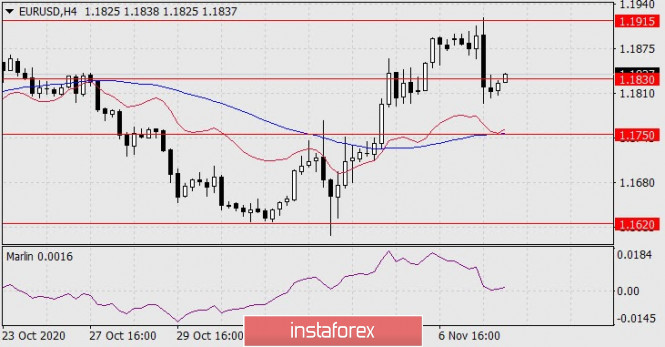
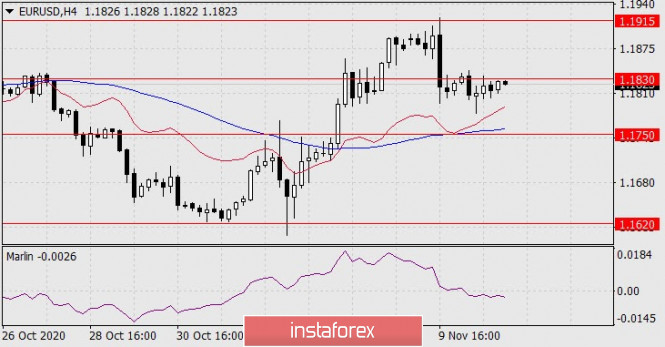
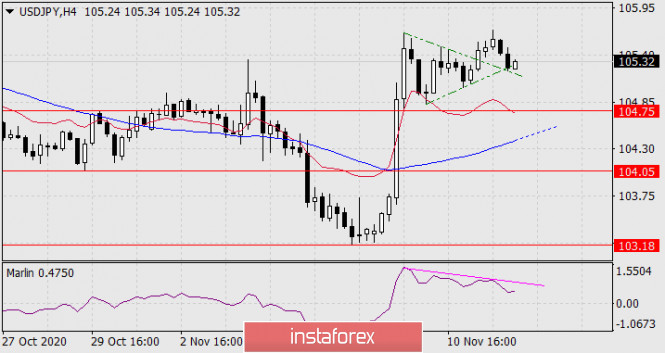
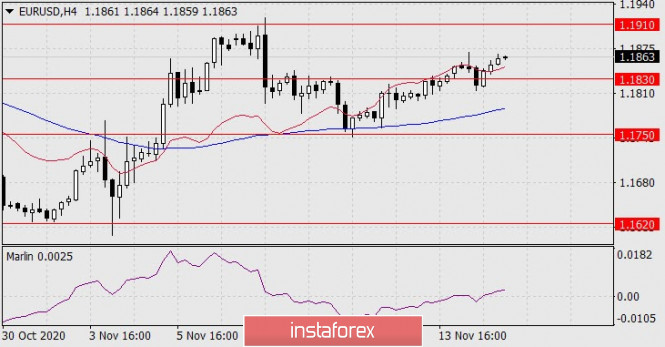
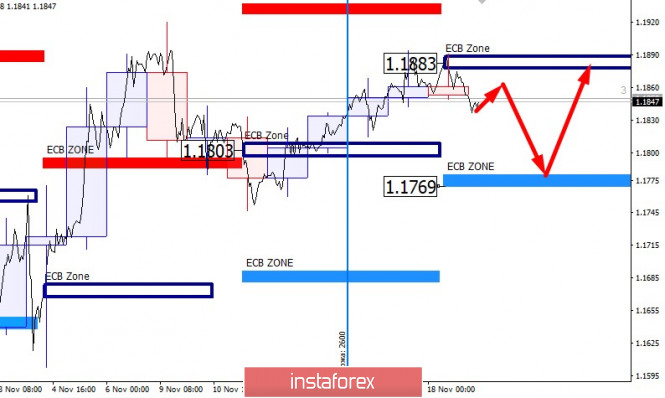
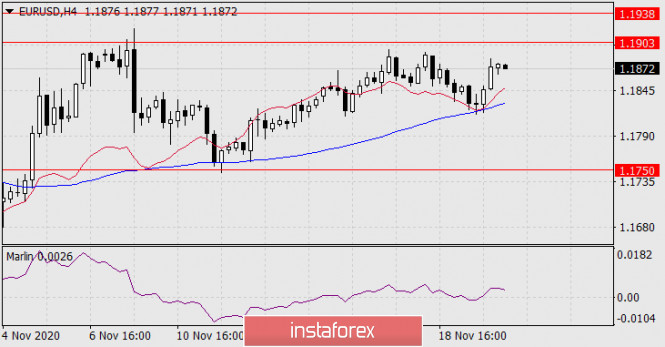
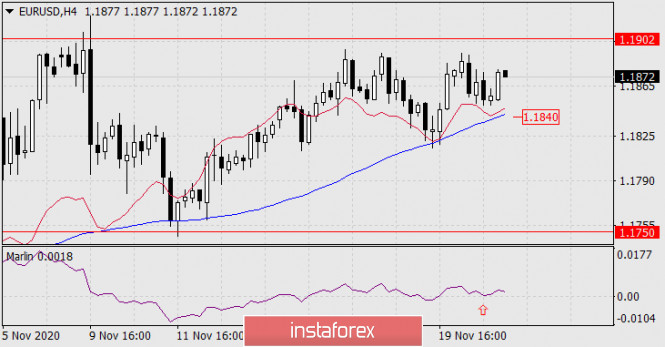
    The price has settled below the nearest level of 1.1830 on the four-hour chart, while the Marlin oscillator is attacking the border of the bears' territory. Falling below yesterday's low may extend the movement to the MACD line towards the target level of 1.1750. And being able to settle below it will become a sign of the price's intention to go down further, where the first target will be the level of 1.1620. The likelihood of rising and falling further at the moment is roughly 55% versus 45%. We are waiting for the situation to unfold.

    Analysis are provided byInstaForex.
    Best regards, PR Manager
    Learn more about InstaForex Company at http://instaforex.com

  2. #792
    Senior Member InstaForex Gertrude's Avatar
    Join Date
    Sep 2015
    Posts
    1,885
    Forecast for EUR/USD on November 11, 2020

    EUR/USD
    The euro traded with a range of 30 points on Tuesday, closing the day near its opening. Markets took a short break after Monday's increased activity. The euro was unable to grow following oil (4.95%) and gold (0.75%), since the index of economic sentiment in the euro area fell from 52.3 to 32.8 in November and also on the understanding that the recent report of Pfizer about 90% effectiveness of their vaccine meant that 94 out of 43,538 people with covid were vaccinated, it is assumed that all vaccinated test participants were then infected with the virus to obtain statistical material. Of course, the participants in the experiment were not intentionally infected, and the message was a common PR move.


    But does this mean that the euro will fall? This cannot be answered in the current situation, since the price is in a neutral position from a technical point of view - the price is settling below the target level of 1.1830 with the horizontally moving Marlin oscillator on the daily chart. There is interest in buying when the price is above the balance line, but the medium and long-term trend is adjusted downward when it is below the MACD line. Since no mood is clearly expressed, and if we assume that the fervor of the bulls has not yet dried up, then the price may try to attack the MACD line for the second time. Getting the price to settle below the 1.1750 level, will most likely cause a desire to reach the September low (1.1620).


    The price is settling above both indicator lines on the four-hour chart, while the Marlin oscillator is in the declining zone. Taken together, this may be a sign of consolidation with the intention to break down below the MACD line, near the target level 1.1750.

    Analysis are provided byInstaForex.
    Best regards, PR Manager
    Learn more about InstaForex Company at http://instaforex.com

  3. #793
    Senior Member InstaForex Gertrude's Avatar
    Join Date
    Sep 2015
    Posts
    1,885
    Forecast for USD/JPY on November 12, 2020

    USD/JPY
    On the daily chart for the third day, the Japanese yen is held above the MACD line. The Marlin oscillator is developing in a small horizontal range, increasing the probability of price growth to the nearest target of 106.03 along the price channel line.


    But this plan has an alternative, which manifests itself when considering the situation on a four-hour scale. Yesterday, the price went up from the triangle, then returned to its top, converting the triangle into a flag.


    Meanwhile, a divergence was formed based on Marlin. Since the price is close to going under the forming lines of the flag and triangle, working out the target level of 104.75 is possible. By this time, the Marlin oscillator on the daily timeframe may be in the zone of negative values. Fixing the price at 104.75 will open the target of 104.05 at the minimum on September 21. If the price is fixed at 104.75, the MACD line on H4 can be easily overcome by increasing dynamics. The probability of both upward and downward development is the same, and the uncertainty can be resolved today.

    Analysis are provided byInstaForex.
    Best regards, PR Manager
    Learn more about InstaForex Company at http://instaforex.com

  4. #794
    Senior Member InstaForex Gertrude's Avatar
    Join Date
    Sep 2015
    Posts
    1,885
    ]Forecast for USD/JPY on November 13, 2020

    USD / JPY
    The Japanese yen, under yesterday's pressure from the stock market, strengthened (decreased on the chart) by 29 pips, breaking the support of the MACD line on the daily chart. Then, today during the Asian session, the USD / JPY pair lost the same amount, and in order for the quotes to continue the decline, the bears have to overcome the support of the price channel at 104.75. Around the same time, the Marlin Oscillator will move into negative territory, which will strengthen the declining market sentiment. The target of the movement will be the level of 104.05, which is near the lows reached on October 29 and September 21.


    The four-hour chart shows that the MACD line (104.52) is located slightly below the level of 104.75. Therefore, to ensure that the pair does not fall under the price channel, the quotes have to fall below the MACD line. Converging the price with the Marlin Oscillator will be effective for this, especially since at the moment, the signal line has already entered the zone of negative values. The prevailing scenario is bearish, and a consolidation below 104.05 will certainly trigger a downward move towards 103.18.


    Analysis are provided byInstaForex.
    Best regards, PR Manager
    Learn more about InstaForex Company at http://instaforex.com

  5. #795
    Senior Member InstaForex Gertrude's Avatar
    Join Date
    Sep 2015
    Posts
    1,885
    Technical Analysis of ETH/USD for November 16, 2020


    Crypto Industry Outlook:
    Binance CEO Changpeng Zhao said he needed to do more to block "smart" US traders from illegally accessing its global stock exchange. In an interview with the financial media, CZ said its stock exchange needs to be "smarter about the way we block" US traders from accessing the platform:

    "Basically, we are constantly trying to improve our security. Sometimes there are a few guys who want to bypass our locks and still use the platform. We have to come up with a smarter way to strengthen protection, and when we do, we lock them."

    Binance, which is the world's largest cryptocurrency exchange by volume, stopped serving US traders in September 2019 due to regulatory risk. The stock market later launched Binance.US in partnership with BAM Trading Services, which was approved by the Financial Crimes Enforcement Network to serve US clients. Binance.US is a separate entity that licenses technology from Binance and receives brand support from the Malta Stock Exchange.

    Binance.US transaction volumes are said to be only a small fraction of the daily turnover on the main Binance exchange. However, reported volumes are often inflated and do not reflect actual trading activity. It is said that the big stock exchanges continue to publish false figures.

    Technical Market Outlook:
    The ETH/USD pair has been seen moving lower towards the level of $440 after the corrective cycle had started. The local low was made at the level of $438.18, but the market keeps moving inside of the descending channel. The outlook remains bullish and the next target for bulls is the swing high located at the level of $476.29. The nearest technical resistance is seen at the level of $459.47. Only if a daily candle closes below $360 level, then the bears will have full control of the market and might push the prices deeper below this level.

    Weekly Pivot Points:
    WR3 - $507.71
    WR2 - $490.25
    WR1 - $463.71
    Weekly Pivot - $448.80
    WS1 - $421.33
    WS2 - $405.66
    WS3 - $377.90

    Trading Recommendations:
    The up trend on the Ethereum continues and the next long term target for ETH/USD is seen at the level of $500, so any correction or local pull-back should be used to open the buy orders. This scenario is valid as long as the level of $309.61 is broken.

    Analysis are provided byInstaForex.
    Best regards, PR Manager
    Learn more about InstaForex Company at http://instaforex.com

  6. #796
    Senior Member InstaForex Gertrude's Avatar
    Join Date
    Sep 2015
    Posts
    1,885
    Forecast for EUR/USD on November 17, 2020


    EUR/USD
    Markets continue to actively play out the popular topic of coronavirus vaccines. Yesterday, American company Moderna announced successful tests of the second phase. The US stock index S&P 500 rose by 1.16%, the euro by 17 points. Obviously, until new investment topics are available, investors continue to be optimistic about the development of new vaccines and the vaccination process itself. But this topic will soon become boring, because yesterday's growth was not as pronounced as it was after the news from Pfizer.

    The daily chart shows that nothing is holding back the price from moving to the nearest targets of 1.1910 along the MACD line and 1.1940 along the line of the descending price channel. The Marlin oscillator is growing.


    The four-hour chart shows that the price settled above the balance indicator line, which strengthened the mood for buy positions on the euro, the Marlin oscillator also settled in the positive trend zone. Yesterday's trading volume exceeded Friday's. We are waiting for the EUR/USD to rise towards the designated targets.

    Analysis are provided byInstaForex.
    Best regards, PR Manager
    Learn more about InstaForex Company at http://instaforex.com

  7. #797
    Senior Member InstaForex Gertrude's Avatar
    Join Date
    Sep 2015
    Posts
    1,885
    AUD/USD Forecast for November 18, 2020

    AUD / USD The Australian Dollar lost 20 points yesterday. Yesterday's peak allowed us to form a divergence with the Marlin oscillator. To fix it and actually turn the market down, the price needs to be fixed under the Kruzenshtern line-- below 0.7264-- and then fall below the nearest target level of 0.7222 at least on November 12-13. The nearest target is 0.7120.


    On the four-hour chart, the price is already attacking the Kruzenshtern line at 0.7275. Note that the Krusenstern lines on both time charts almost coincide in price, which makes the 0.7264/75 range particularly important.


    Fixing under the specified range can trigger a strong drop in the price. The signal line of the Marlin oscillator on H4 has already entered the zone of negative values. The probability of a downward scenario is 80%.

    Analysis are provided byInstaForex.
    Best regards, PR Manager
    Learn more about InstaForex Company at http://instaforex.com

  8. #798
    Senior Member InstaForex Gertrude's Avatar
    Join Date
    Sep 2015
    Posts
    1,885
    EURUSD. Central European Bank has designated the level of resistance

    Yesterday's reaction to the bank level of 1.1883 indicates that growth is being held by placing large limit orders. There is a high probability of a decline to the support zone formed from the level of 1.1769. This model is a priority at the end of this week and the beginning of next week.


    This model will continue to form a medium-term accumulation zone. It is important to understand that sales must be recorded when testing the lower banking zone. This will help in avoiding missed opportunities.

    If the test of the 1.1769 level leads to a large demand, then you will need to open purchases. The growth target will be a return to the level of 1.1883. This model is valid until next Wednesday which makes purchases profitable after a decline to 1.1769. Don't forget to fix your positions when you reach the support and resistance zones.

    Analysis are provided byInstaForex.
    Best regards, PR Manager
    Learn more about InstaForex Company at http://instaforex.com

  9. #799
    Senior Member InstaForex Gertrude's Avatar
    Join Date
    Sep 2015
    Posts
    1,885
    Forecast for EUR/USD on November 20, 2020

    EUR/USD
    Yesterday, the euro showed increased dynamics on average trading volumes, the range was 68 points. The support was provided by the balance and MACD indicator lines on the four-hour chart. The Marlin oscillator did not manage to gain a foothold in the bears' territory and went back to the growth area. We have a rising trend on the four-hour chart. The nearest target 1.1903 is the MACD line on the daily chart.


    The daily chart shows that the situation also tends to rise, but the resistance of the MACD line looks strong, the price has pulled back from it twice in the last three days.


    If the euro gathers strength, it is possible to overcome the 1.1903 level and even reach the border of the price channel at 1.1938, but further growth is possible only with strong fundamental factors. In this case, the target is the 1.2010/40 range.

    In general, the euro confirmed that it is not going to leave the wide free roaming zone of 1.1750-1.1930. We are waiting for the development of events.

    Analysis are provided byInstaForex.
    Best regards, PR Manager
    Learn more about InstaForex Company at http://instaforex.com

  10. #800
    Senior Member InstaForex Gertrude's Avatar
    Join Date
    Sep 2015
    Posts
    1,885
    Forecast for EUR/USD on November 23, 2020

    EUR/USD
    The euro settled below the MACD indicator line on the daily chart for the last two days. A pronounced consolidation provides more prerequisites for overcoming the resistance of the MACD line (1.1902), which will help the euro reach the upper border of the downward price channel on a weekly scale (1.1936) and even to its breakout with the subsequent target at 1.2010. And from a fundamental point of view, this scenario is reinforced by the next postponement of the Brexit deadline to December 10, which is when the Brexit deal is expected to be adopted at the EU summit. The agreement itself may be ready by November 30th.


    The Marlin oscillator does not provide hints on the daily scale, it moves horizontally.
    The four-hour chart shows that Marlin is turning upward from the border of the bears' territory, the price is developing above the balance and MACD lines, which ultimately increases the likelihood of rising further to about 60%.


    The growing market sentiment may be shaken when the price settles below the MACD line at the four-hour chart, below 1.1840 to be more specific. The 1.1750 target level will become relevant again. We are waiting for the development of events.

    Analysis are provided byInstaForex.
    Best regards, PR Manager
    Learn more about InstaForex Company at http://instaforex.com

Page 80 of 164 FirstFirst ... 30 70 78 79 80 81 82 90 130 ... LastLast

Tags for this Thread

Bookmarks

Posting Permissions

  • You may not post new threads
  • You may not post replies
  • You may not post attachments
  • You may not edit your posts
  •