Page 70 of 166 FirstFirst ... 20 60 68 69 70 71 72 80 120 ... LastLast
Results 691 to 700 of 1652

Wave Analysis by InstaForex

This is a discussion on Wave Analysis by InstaForex within the Analytics and News forums, part of the Trading Forum category; Forecast for EUR/USD on June 22, 2020 EUR/USD Last Friday, buyers of the dollar managed to restrain the onslaught of ...


  1. #691
    Senior Member InstaForex Gertrude's Avatar
    Join Date
    Sep 2015
    Posts
    1,885
    Forecast for EUR/USD on June 22, 2020

    EUR/USD
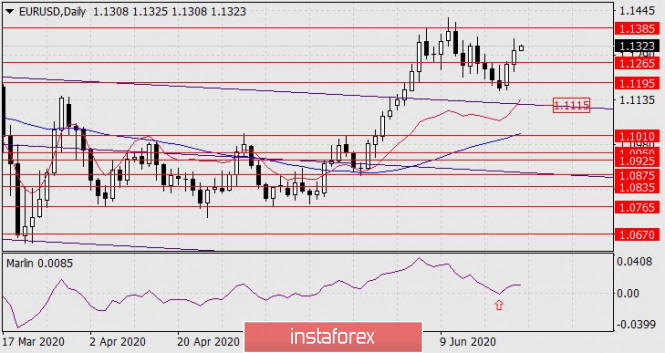
    Last Friday, buyers of the dollar managed to restrain the onslaught of the euro bulls and keep the single currency in a downward local trend of the last ten days. The signal line of the Marlin oscillator on the daily chart has penetrated the territory of the bears, now it is easier for the market trend to reach the target along the embedded line of the price channel of 1.1115. Overcoming this support opens the second target of 1.1010.


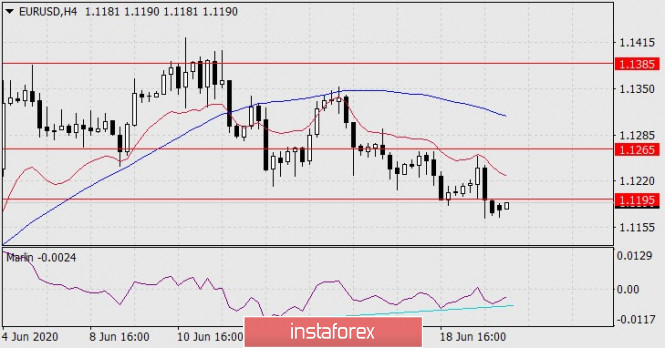
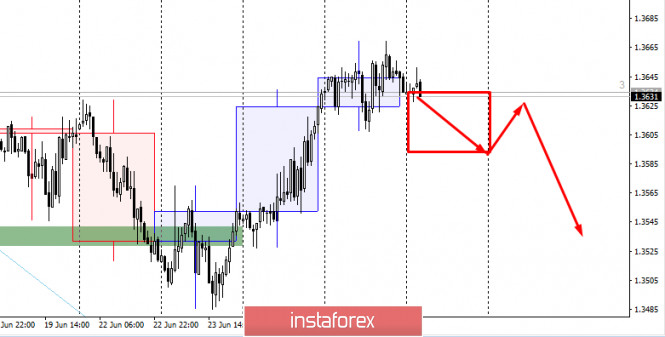
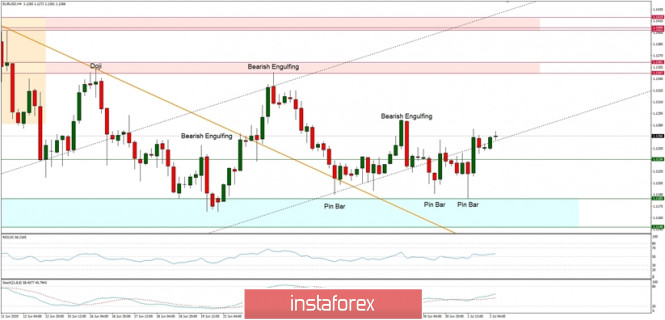
    The four-hour chart shows that the euro's growth in the first half of the day was restrained by the balance indicator line, that is, the growth occurred in the framework of the general decreasing trend, which strengthens this trend itself. Now in the struggle of the local trend with convergence, the Marlin oscillator has a higher chance of winning the trend. We are waiting for the price at 1.1115.


    Analysis are provided byInstaForex.
    Best regards, PR Manager
    Learn more about InstaForex Company at http://instaforex.com

  2. #692
    Senior Member InstaForex Gertrude's Avatar
    Join Date
    Sep 2015
    Posts
    1,885
    Technical Analysis of EUR/USD for June 23, 2020:


    Technical Market Outlook:
    The EUR/USD pair has tested the lower level of the support range located at 1.1185 and bounced towards the short-term trend line resistance located around the level of 1.1265. The oversold market conditions might help the bulls to test the nearest technical resistance, but they must break through the short-term trend line resistance in order to regain the control over the market. Any violation of the level of 1.1148 will accelerate the sell-off towards the next technical support seen at 1.0009. So, it is important for bulls to defend this level, but only a sustained violation of the short-term trend line resistance would put them back into control (around the level of 1.1300).

    Weekly Pivot Points:
    WR3 - 1.1456
    WR2 - 1.1397
    WR1 - 1.1266
    Weekly Pivot - 1.1215
    WS1 - 1.1074
    WS2 - 1.1031
    WS3 - 1.0903

    Trading Recommendations:
    On the EUR/USD pair, the main long-term trend is down, but the local up trend continues. The key long-term technical support is seen at the level of 1.0336 and the key long-term technical resistance is seen at the level of 1.1540. Only if one of this levels is clearly violated, the main trend might reverse (1.1540) or accelerate (1.0336).

    Analysis are provided byInstaForex.
    Best regards, PR Manager
    Learn more about InstaForex Company at http://instaforex.com

  3. #693
    Senior Member InstaForex Gertrude's Avatar
    Join Date
    Sep 2015
    Posts
    1,885
    Forecast for EUR/USD on June 24, 2020

    EUR/USD
    The euro grew by 48 points on Tuesday, almost consolidating itself above the target level of 1.1265 after a reversal of the Marlin oscillator signal line from the zero border line dividing the decline zone from the oscillator growth zone, indicating the prospect of a market trend. The next target of 1.1385 is formally open, but it may not be achieved, which can be seen when considering the situation on a smaller timeframe.


    Marlin's signal line went beyond the upper boundary of its own channel on the H4, but soon returned to it. This is already a sign of the falsity of the past price spike. And here two scenarios are possible: a slower growth of the euro in the range of 1.1353/85 with a divergence forming according to Marlin, and a reversal of the euro down without reaching 1.1353 (the June 16 high), practically from current levels. The first signal for this is the price drift under the MACD line (1.1295).


    Thus, it is late and unreliable to buy the euro, and early to sell. We are waiting for the resolution of the situation.

    Analysis are provided byInstaForex.
    Best regards, PR Manager
    Learn more about InstaForex Company at http://instaforex.com

  4. #694
    Senior Member InstaForex Gertrude's Avatar
    Join Date
    Sep 2015
    Posts
    1,885
    Elliott wave analysis of EUR/JPY for June 25, 2020


    EUR/JPY is in a minor correction from 121.10 preparing for a new impulsive rally higher towards the key-resistance at 122.12. A break above here will confirm that wave 2 has been completed. It is likely to test 119.41 and wave 3 is in motion for an ultimate break above the peak at 124.43.

    In the short-term, we are looking for a break above minor resistance at 120.75 to confirm this minor correction is completed and the rally to 122.12 is unfolding.

    R3: 122.12
    R2: 121.58
    R1: 121.23
    Pivot: 120.75
    S1: 120.19
    S2: 119.88
    S3: 119.60

    Trading recommendation:
    We are long EUR from 119.95 and we have our stop placed at 119.35.

    Analysis are provided byInstaForex.
    Best regards, PR Manager
    Learn more about InstaForex Company at http://instaforex.com

  5. #695
    Senior Member InstaForex Gertrude's Avatar
    Join Date
    Sep 2015
    Posts
    1,885
    Control zones for USD/CAD on June 26, 2020

    The main direction of the USD / CAD pair is upward, so buy positions are currently the most profitable in the medium term. The nearest resistance is the monthly control zone in June, the lower border of which is located at the highs of last week. This increases the likelihood of a stunt in the coming days.


    The next target area is the WCZ 1/2 1.3783-1.3767, so part of the positions may be left in the hopes of its test. However, a fall and continued formation of the accumulation zone will occur, if an "absorption" pattern forms today in the daily chart. The closing of weekly trades will be the new starting point for both upward and downward patterns.


    Daily CZ - daily control zone. The area formed by important data from the futures market, which changes several times a year.
    Weekly CZ - weekly control zone. The area formed by the important marks of the futures market, which changes several times a year.
    Monthly CZ - monthly control zone. The area that reflects the average volatility over the past year.

    Analysis are provided byInstaForex.
    Best regards, PR Manager
    Learn more about InstaForex Company at http://instaforex.com

  6. #696
    Senior Member InstaForex Gertrude's Avatar
    Join Date
    Sep 2015
    Posts
    1,885
    Technical Analysis of BTC/USD for June 29, 2020:


    Crypto Industry News:
    Over the past few years, cryptocurrencies have attracted a lot of interest from institutional investors. Encryption has become quite popular due to more rules on the digital asset market. However, since most economies work with digital resources, there has also been pressure to strengthen regulations so that cryptocurrencies do not become a safe haven for money laundering and other illegal activities. Recent AML regulations and FAFT guidelines aimed to strengthen cryptography regulations.

    However, as digital assets are gaining popularity in the world of finance, traditional financial institutions such as banks have now come under the eye of dealing with cryptocurrency users and stock exchanges regarding virtual assets. A recent Ciphertrace report looked at how virtual asset laws can affect banks. The report notes that 57% of these Virtual Asset Providers (VASPs) had weak or porous KYC processes. This is a greater threat because a weak KYC can lead to bad entities being able to launder virtual assets through stock exchanges operating as fiat off-ramps according to the report.

    It is not clear, however, whether large banks are willing or willing to cope with exposure to crypto assets and at the same time ensure that there is no illegal activity in space. Although the number of cryptocurrencies has increased significantly over the years, mainstream banks still have reservations about users and cryptographic transactions. In the recent past, Bank of America raised concerns and kept customers from using debit cards to buy cryptocurrency. However, at the beginning of the Fifth Anti-Money Laundering Directive or AMLD5 it was pointed out that banks cannot refuse to provide services to sectors and must analyze cryptocurrencies on a case-by-case basis.

    According to data provided by Ciphertrace, almost 74% of Bitcoins transferred in "from exchange to exchange" transactions have been transferred cross-border and pose a significant risk of money laundering. Given this scenario, FATF noted that illegal users of virtual assets (VAs) may, for example, benefit from the global reach and transaction speed that VA provides, as well as from inadequate regulation or supervision of financial activities and VA suppliers in various jurisdictions, resulting in inconsistent legal and regulatory rules of the game in the VA ecosystem.

    Technical Market Outlook:
    The BTC/USD pair has made a new local low at the level of $8,795, which means the key short-term technical support located at the level of $8,858 had been violated. The bounce has been continued for some time now, but so far it was rather shallow and the price is starting to reverse again. If the intraday support located at the level of $8,971 is clearly violated, the odds for another low are high as the momentum is still weak and negative. The next target for bears is seen at the level of $8,565.
    Weekly Pivot Points:
    WR3 - $10,465
    WR2 - $10,072
    WR1 - $9,509
    Weekly Pivot - $9,126
    WS1 - $8,593
    WS2 - $8,191
    WS3 - 7,623

    Trading Recommendations:
    The larger time frame trend remains down and as long as the level of $10,791 is not violated, all rallies will be treated as a counter-trend corrective moves. This is why the short positions are now more preferred until the level of $10,791 is clearly violated. The key mid-term technical support is located at the level of $7,897.

    Analysis are provided byInstaForex.
    Best regards, PR Manager
    Learn more about InstaForex Company at http://instaforex.com

  7. #697
    Senior Member InstaForex Gertrude's Avatar
    Join Date
    Sep 2015
    Posts
    1,885
    Technical Analysis of GBP/USD for June 30, 2020:


    Technical Market Outlook:
    The GBP/USD pair has made another local low at the level of 1.2251 after all the bounces were too shallow to trigger a strong rally. The price is back inside the descending channel and despite the oversold market conditions, the momentum remains weak and negative as the RSI indicator hovers below its fifty level. The nearest technical resistance is seen at the level of 1.2361 and 1.2406. The larger time frame trend remains bullish.

    Weekly Pivot Points:
    WR3 - 1.2667
    WR2 - 1.2600
    WR1 - 1.2441
    Weekly Pivot - 1.2377
    WS1 - 1.2213
    WS2 - 1.2143
    WS3 - 1.1969

    Trading Recommendations:
    On the GBP/USD pair the main trend is down, which can be confirmed by the down candles on the weekly time frame chart. The key long-term technical support has been recently violated (1.1983) and the new one is seen at the level of 1.1404. The key long-term technical resistance is seen at the level of 1.3518. Only if one of these levels is clearly violated, the main trend might reverse (1.3518) or accelerate (1.1404). The market might have done a Double Top pattern at the level of 1.2645, so the price might move even lower in the longer-term.

    Analysis are provided byInstaForex.
    Best regards, PR Manager
    Learn more about InstaForex Company at http://instaforex.com

  8. #698
    Senior Member InstaForex Gertrude's Avatar
    Join Date
    Sep 2015
    Posts
    1,885
    Technical Analysis of BTC/USD for July 1, 2020:


    Crypto Industry News:
    Anxiety in the cryptocurrency community is growing every day. No change in Bitcoin prices, trade between $ 9,000 to $ 9,500, for almost two months is currently not perceived as a feature of the strongest cryptocurrency in the world, but rather its relationship with larger financial markets.

    Bitcoin, for most of this year, when the pandemic began shifting markets, acted against itself. According to the "uncorrelated" status, the cryptocurrency reached enormous highs when both the stock market and the commodity market collapsed, losing millions. This is despite the fact that Bitcoin lost over 50% of its value in one day in March and increased its supply by 50% in May.

    However, now that price and supply have normalized, the unstable asset is stable from the outset, and some cryptocurrency community members suggest that the reason is that it has not yet separated from the stock market.

    Bitcoins and the larger cryptocurrency market, despite being called 'decentralized', have often exerted an impact on macroeconomic activities, usually affecting traditional markets. Last year, Bitcoin saw movement in the gold market on various isolated occasions, mainly because of the safe harbor narrative in times of economic or political turmoil.

    Now the prices on the stock market offset the negative effects of the slowdown of global economies by a pandemic and the inflow of liquidity from central banks. At this time, Bitcoin is actually moving according to the highest stock index, S & P500. Market data indicate that the 1-month correlation of Bitcoins with S & P500 is the highest in over a year, and is currently estimated at over 42.6%.

    Because Bitcoin is "coupled" with S & P500, this presents a different set of short-term fate for cryptocurrency in the future. Given the likelihood of a second package of government assistance in the United States, another injection of freshly minted dollars may again positively affect Bitcoin, as it did in May. Another scenario is the second wave of COVID-19 cases that could cause another liquidation madness.

    Technical Market Outlook:
    The BTC/USD pair has made a new local high at the level of $9,129, but there is a Doji candlestick pattern made at the top of this move, so if the intraday support located at the level of $8,971 is clearly violated, the odds for another low are high. The momentum is still weak and negative, but is getting closer to the level of fifty, which is a neutral level for the momentum indicator. The next target for bears is seen at the level of $8,565, but in a case of an upside breakout, the next target for bulls is seen at the level of $9,249 (technical resistance level).

    Weekly Pivot Points:
    WR3 - $10,465
    WR2 - $10,072
    WR1 - $9,509
    Weekly Pivot - $9,126
    WS1 - $8,593
    WS2 - $8,191
    WS3 - 7,623

    Trading Recommendations:
    The larger time frame trend remains down and as long as the level of $10,791 is not violated, all rallies will be treated as a counter-trend corrective moves. This is why the short positions are now more preferred until the level of $10,791 is clearly violated. The key mid-term technical support is located at the level of $7,897.

    Analysis are provided byInstaForex.
    Best regards, PR Manager
    Learn more about InstaForex Company at http://instaforex.com

  9. #699
    Senior Member InstaForex Gertrude's Avatar
    Join Date
    Sep 2015
    Posts
    1,885
    Technical Analysis of EUR/USD for July 2, 2020:


    Technical Market Outlook:
    The EUR/USD pair has made series of Pin Bar candlesticks just above the key short-term support located at the level of 1.1185 and bounced significantly. The bulls are heading north, so any violation of the level of 1.1287 makes the rally towards the technical resistance located at the level of 1.1347 highly possible, so please keep an eye on the current developments at this market. Please notice the positive market conditions and strong momentum support the short-term bullish outlook.

    Weekly Pivot Points:
    WR3 - 1.1484
    WR2 - 1.1410
    WR1 - 1.1289
    Weekly Pivot - 1.1235
    WS1 - 1.1124
    WS2 - 1.1056
    WS3 - 1.0936

    Trading Recommendations:
    On the EUR/USD pair, the main long-term trend is down, but the local up trend continues. The key long-term technical support is seen at the level of 1.0336 and the key long-term technical resistance is seen at the level of 1.1540. Only if one of this levels is clearly violated, the main trend might reverse (1.1540) or accelerate (1.0336).

    Analysis are provided byInstaForex.
    Best regards, PR Manager
    Learn more about InstaForex Company at http://instaforex.com

  10. #700
    Senior Member InstaForex Gertrude's Avatar
    Join Date
    Sep 2015
    Posts
    1,885
    echnical Analysis of EUR/USD for July 3, 2020:


    Technical Market Outlook:
    After the EUR/USD pair has made series of Pin Bar candlesticks just above the key short-term support located at the level of 1.1185 some serious bounce has been expected, but it turned out the bulls have a fuel only to rally to the level of 1.1302. Then the Bearish Engulfing candlestick was made and the really reversed. The bulls might still be heading north, so any violation of the level of 1.1302 makes the rally towards the technical resistance located at the level of 1.1347 highly possible, so please keep an eye on the current developments at this market. Please notice the positive market conditions and strong momentum support the short-term bullish outlook. Weekly Pivot Points: WR3 - 1.1484 WR2 - 1.1410 WR1 - 1.1289

    Weekly Pivot - 1.1235
    WS1 - 1.1124
    WS2 - 1.1056
    WS3 - 1.0936

    Trading Recommendations:
    On the EUR/USD pair, the main long-term trend is down, but the local up trend continues. The key long-term technical support is seen at the level of 1.0336 and the key long-term technical resistance is seen at the level of 1.1540. Only if one of this levels is clearly violated, the main trend might reverse (1.1540) or accelerate (1.0336).

    Analysis are provided byInstaForex.
    Best regards, PR Manager
    Learn more about InstaForex Company at http://instaforex.com

Page 70 of 166 FirstFirst ... 20 60 68 69 70 71 72 80 120 ... LastLast

Tags for this Thread

Bookmarks

Posting Permissions

  • You may not post new threads
  • You may not post replies
  • You may not post attachments
  • You may not edit your posts
  •