
 6Likes
 LinkBack URL
 About LinkBacks


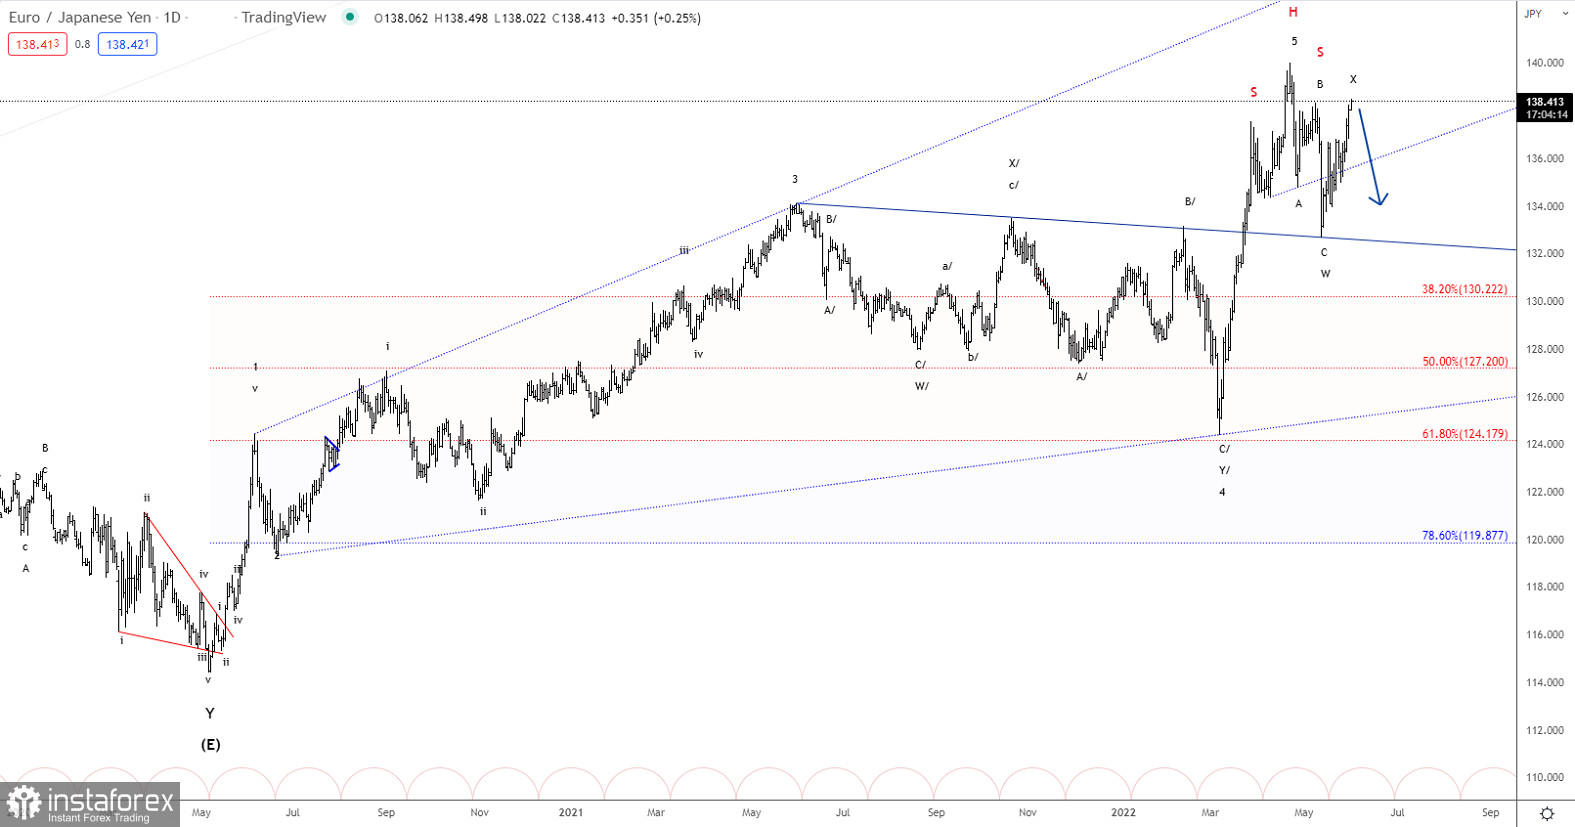
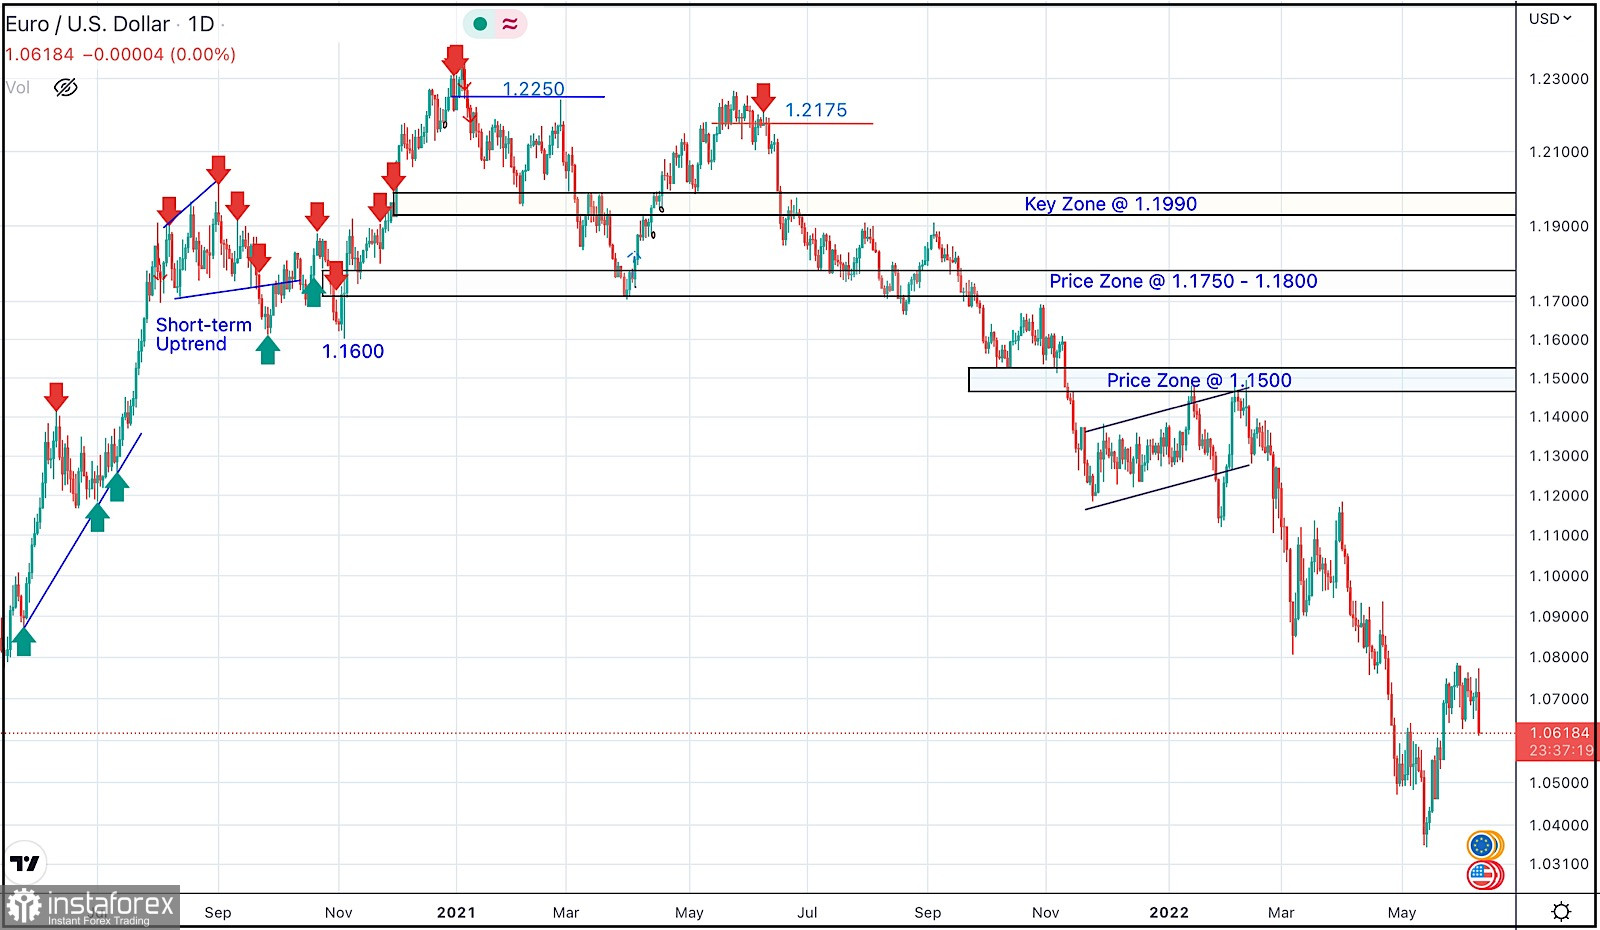
Forex Analysis & Reviews: Elliott wave analysis of EUR/JPY for June 1, 2022
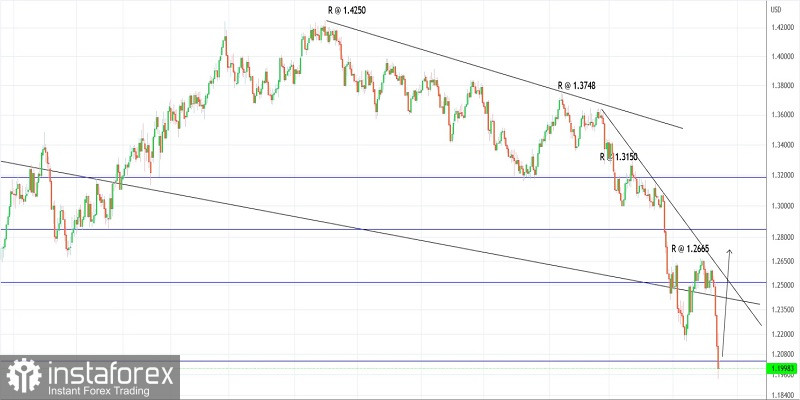
We continue to look for more downside pressure as the correction from 140.04 should persist longer. That said the current rally from 132.66 could peak here at 138.50 but as always with X-waves or B-waves all possible options are open. Therefore, we could also see a flat correction back to test the 140.04 higher before turning lower. But also the option for an expanded flat is open and that would call for a break above 140.04 closer to 142.87 before turning lower again. To confirm that wave X is complete we need a break below minor support at 136.80 that would call for renewed downside pressure towards 130.22.
Analysis are provided byInstaForex.
Read More


 Reply With Quote


Bookmarks