Page 119 of 180 FirstFirst ... 19 69 109 117 118 119 120 121 129 169 ... LastLast
Results 1,181 to 1,190 of 1800

Wave Analysis by InstaForex

This is a discussion on Wave Analysis by InstaForex within the Analytics and News forums, part of the Trading Forum category; Forex Analysis & Reviews: Technical Analysis of GBP/USD for May 18, 2022 Technical Market Outlook: The GBP/USD pair has been ...


  1. #1181
    Senior Member InstaForex Gertrude's Avatar
    Join Date
    Sep 2015
    Posts
    1,885
    Forex Analysis & Reviews: Technical Analysis of GBP/USD for May 18, 2022


    Technical Market Outlook:
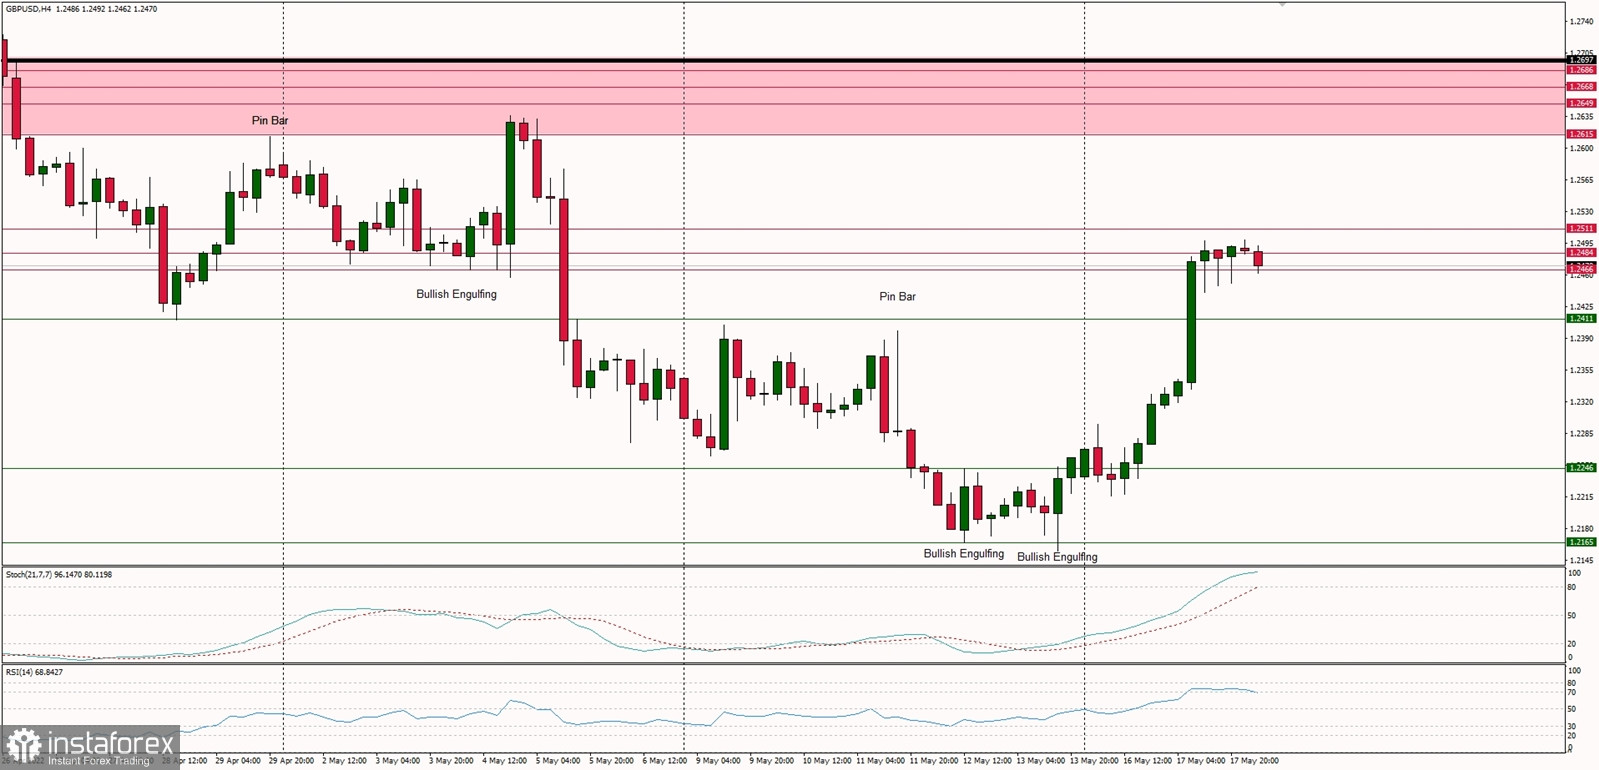
    The GBP/USD pair has been seen bouncing from the swing low located at the level of 1.2155 and bulls had broken through the immediate intraday technical resistance at 1.2411. The technical resistance located at the level of 1.2484 is being tested currently, so any breakout through this level will open the road towards 1.2615 - 1.2697 zone. Despite the oversold market conditions on the H4 and Daily time frame charts there is no indication of trend termination or reversal just yet, so any move up must be seen only as a corrective cycle during the down trend. The bearish pressure will likely resume soon and the next technical support is seen at the level of 1.2165 and 1.2072.

    Weekly Pivot Points:
    WR3 - 1.2621
    WR2 - 1.2514
    WR1 - 1.2371
    Weekly Pivot - 1.2267
    WS1 - 1.2119
    WS2 - 1.2008
    WS3 - 1.1859

    Trading Outlook:
    The price broke below the level of 1.3000, so the bears enforced and confirmed their control over the market in the long term. The Cable is way below 100 and 200 WMA , so the bearish domination is clear and there is no indication of trend termination or reversal. The next long term target for bears is seen at the level of 1.1989. Please remember: trend is your friend.

    Analysis are provided byInstaForex.
    Best regards, PR Manager
    Learn more about InstaForex Company at http://instaforex.com

  2. #1182
    Senior Member InstaForex Gertrude's Avatar
    Join Date
    Sep 2015
    Posts
    1,885
    Forex Analysis & Reviews: Technical analysis Apple for May 19, 2022


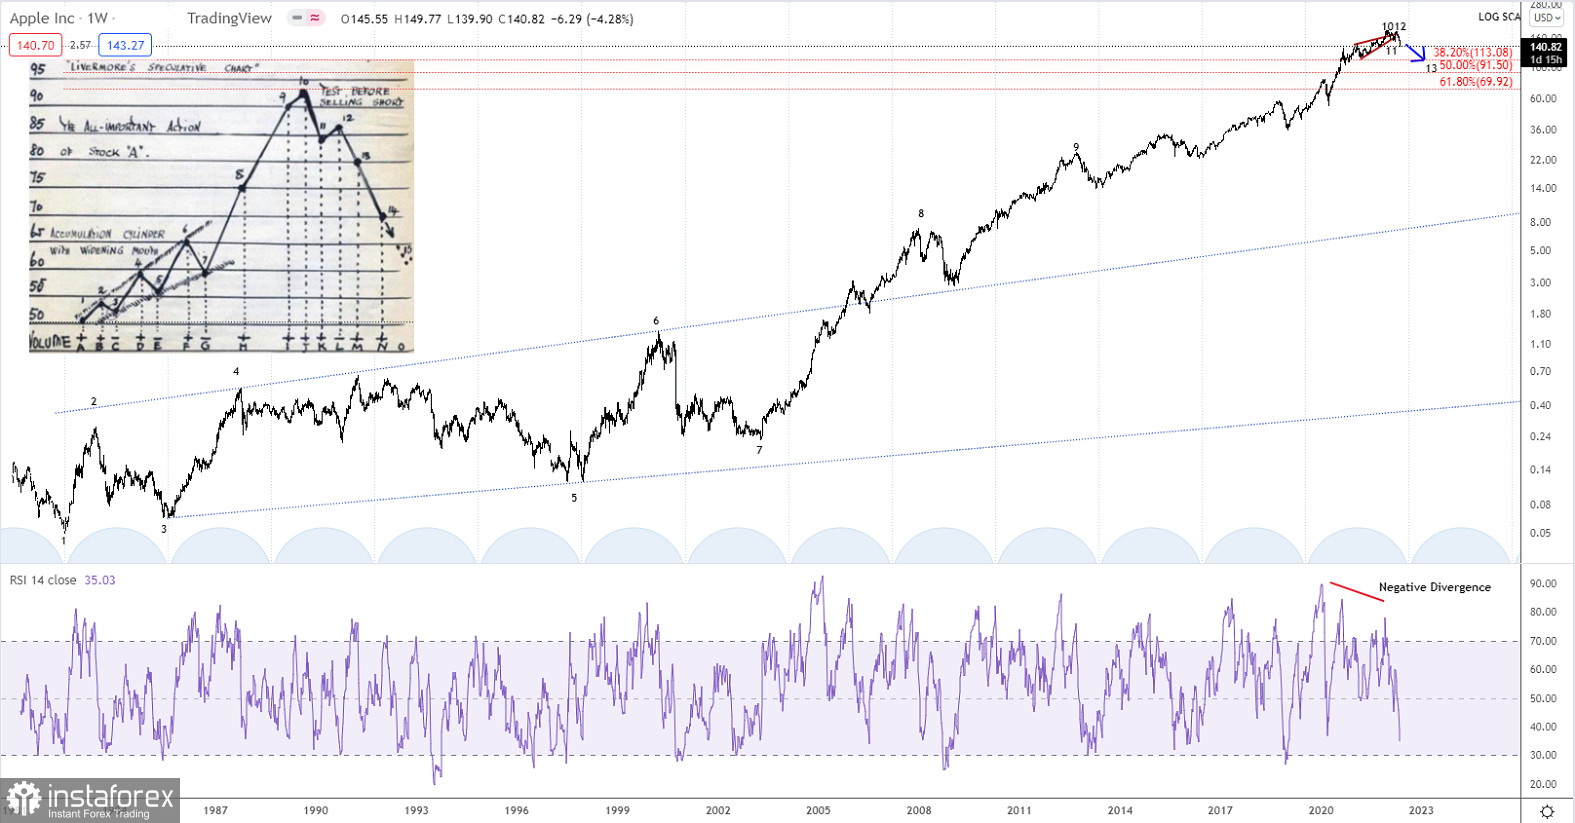
    Apple continues to push lower as expected and should continue lower towards the 38.2% corrective target at 113.08. As we saw it with Target (see our article just before) there is a clear risk, that the Market will be griped by fear and sell-off Apple in a major way.

    Yes it's nice to have the newest iPhone, but is it a necessity? No it's not. If the Market starts to think in those terms, then the risk of a major sell-off is increased big time.

    No matter, if the Market pushes Apple down in a major sell-off or in a more controlled way, the end result will be the same, a decline towards the 113.08 target and possible even closer to the 50% corrective target at 91.50.

    Analysis are provided byInstaForex.
    Best regards, PR Manager
    Learn more about InstaForex Company at http://instaforex.com

  3. #1183
    Senior Member InstaForex Gertrude's Avatar
    Join Date
    Sep 2015
    Posts
    1,885
    Forex Analysis & Reviews: Forecast for EUR/USD on May 20, 2022

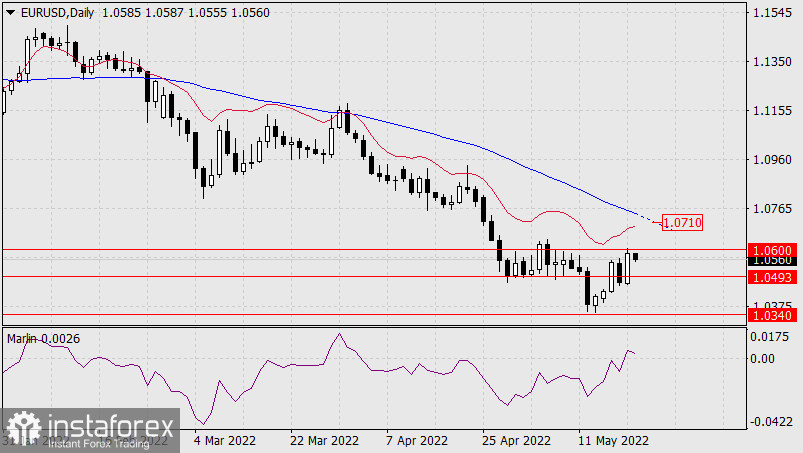
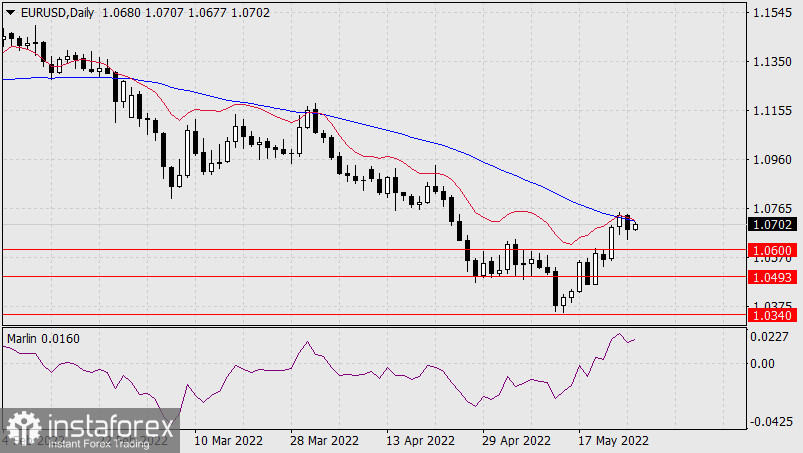
    Yesterday, the euro defied our main plan, suggesting a decline towards 1.0340, but it failed to break the resistance of the upper limit of the 1.0493-1.0600 range. If the price still manages to settle above the level of 1.0600, then the corrective growth may continue to the MACD line, to the area of 1.0710. Formally, the Marlin Oscillator, which has already moved into the positive area, can help the price, but there is a high risk of its quick return to the zero line, that is, form a false signal.


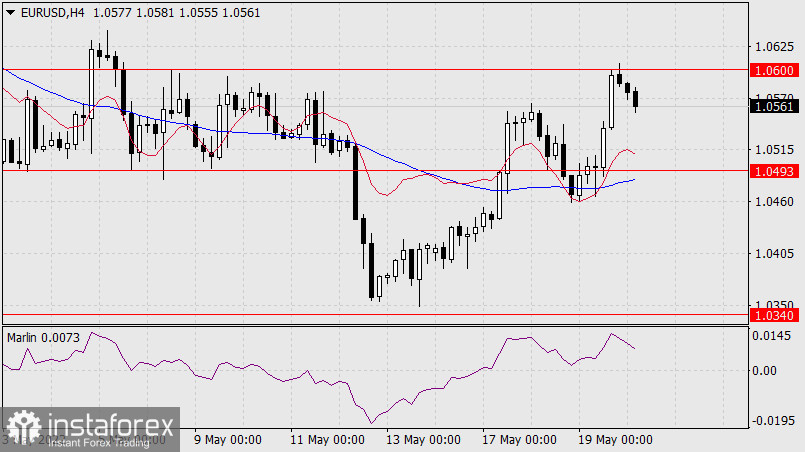
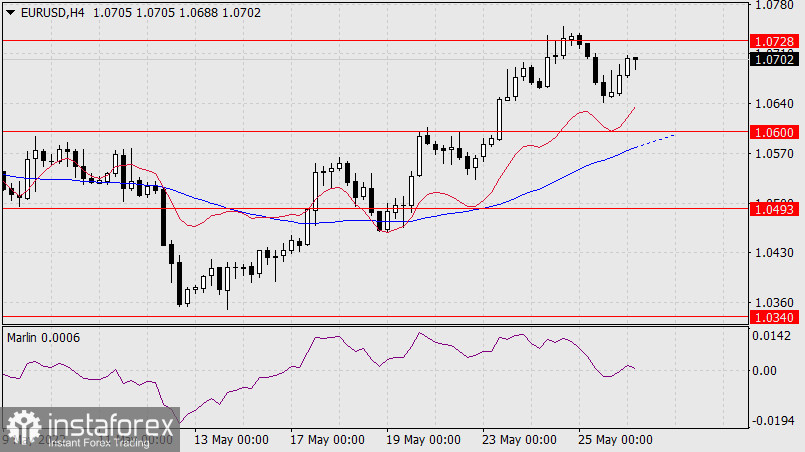
    On the H4 chart, the price reversal from the level of 1.0600 has not yet been expressed. The Marlin Oscillator is not ahead of the price, while it is in the positive area. If the reversal takes place, it will not be fast, it may take two days to exit the range downwards. But this is our main scenario.


    Analysis are provided byInstaForex.

    Read More
    Best regards, PR Manager
    Learn more about InstaForex Company at http://instaforex.com

  4. #1184
    Senior Member InstaForex Gertrude's Avatar
    Join Date
    Sep 2015
    Posts
    1,885
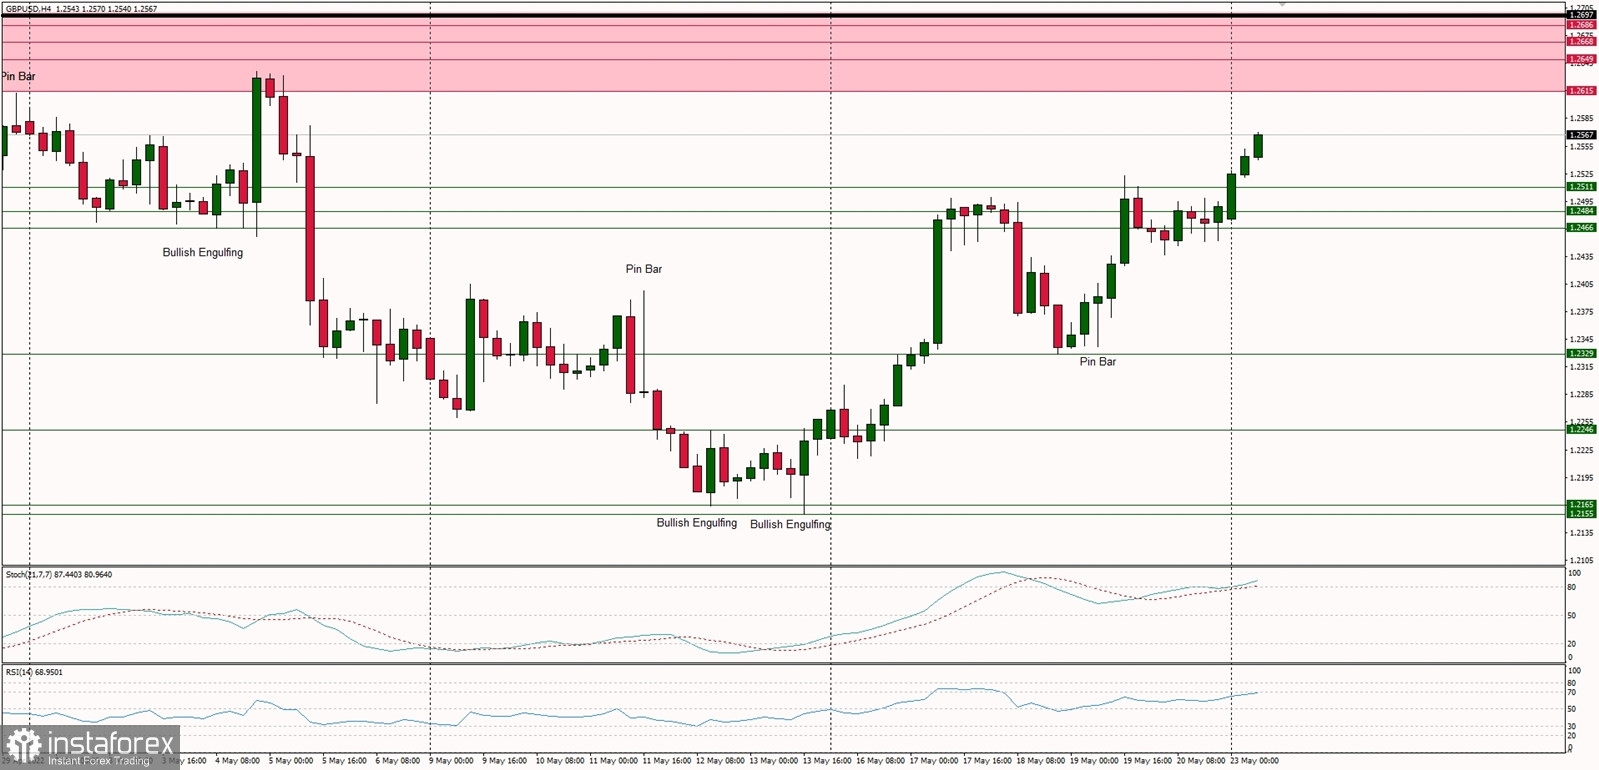
    Forex Analysis & Reviews: Technical Analysis of GBP/USD for May 23, 2022


    Technical Market Outlook:
    The GBP/USD pair has bounced from the lows seen at the level of 1.2155 last week and continues to move higher. Currently, bulls has broken above the technical resistance located at 1.2511 (now intraday support) and are heading towards the key supply zone located between the levels of 1.2615 - 1.2697. Any violation of this zone would change the short-term outlook to more bullish as the market could target even the level of 1.3000 again. The strong and positive momentum support the short-term bullish outlook for Cable, however the market conditions look overbought and quick pull-back is welcome.

    Weekly Pivot Points:
    WR3 - 1.2933
    WR2 - 1.2731
    WR1 - 1.2632
    Weekly Pivot - 1.2626
    WS1 - 1.2321
    WS2 - 1.2106
    WS3 - 1.2001

    Trading Outlook:
    The price broke below the level of 1.3000 six weeks ago, so the bears enforced and confirmed their control over the market in the long term. The Cable is way below 100 and 200 WMA , so the bearish domination is clear and there is no indication of trend termination or reversal. The bulls are now trying to start the corrective cycle, which is welcome after eight weeks of the down move. The next long term target for bears is seen at the level of 1.1989. Please remember: trend is your friend.

    Analysis are provided byInstaForex.

    Read More
    Best regards, PR Manager
    Learn more about InstaForex Company at http://instaforex.com

  5. #1185
    Senior Member InstaForex Gertrude's Avatar
    Join Date
    Sep 2015
    Posts
    1,885
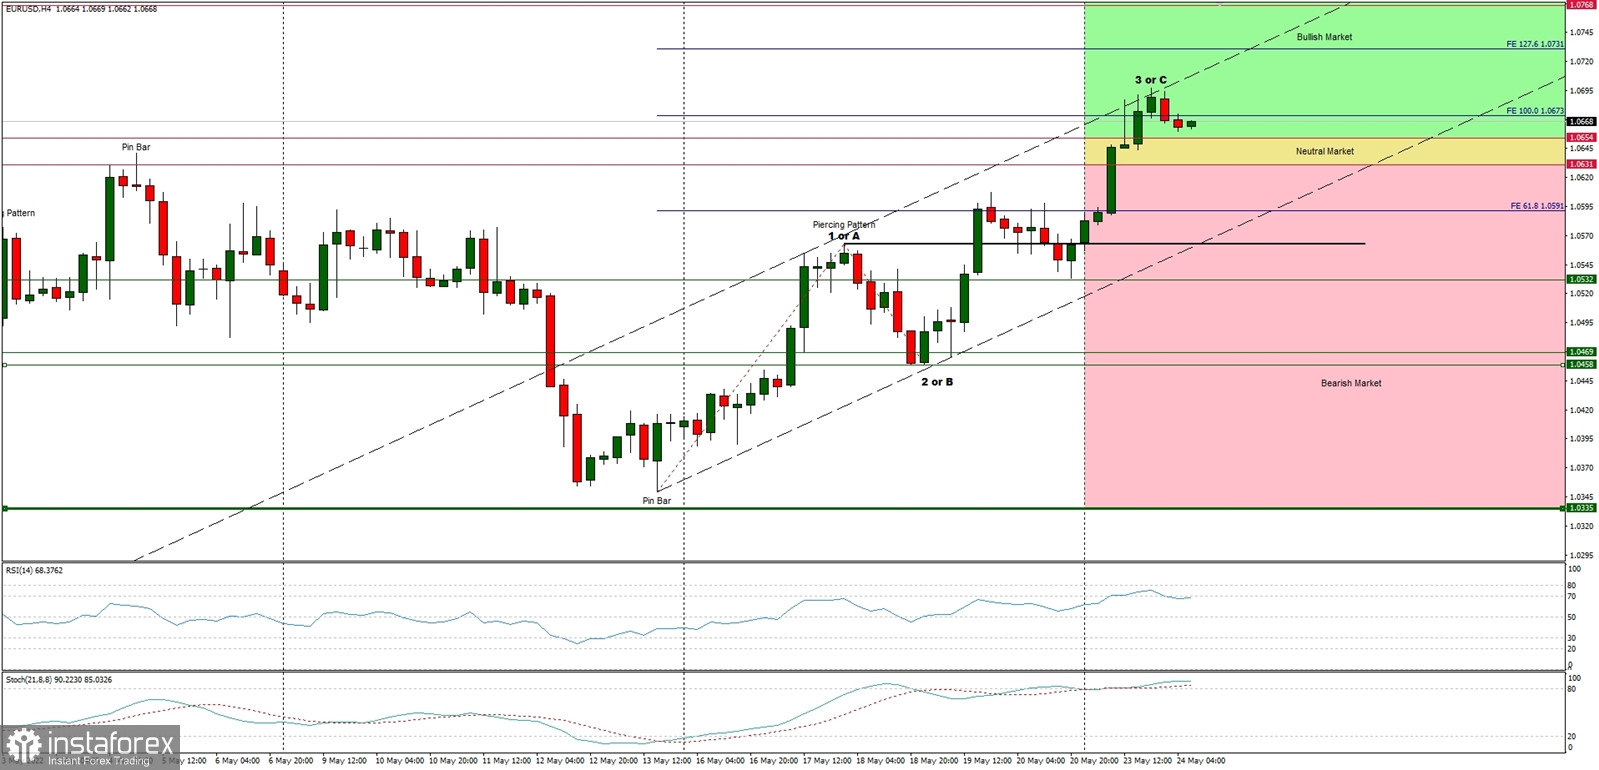
    Forex Analysis & Reviews: Technical Analysis of EUR/USD for May 24, 2022


    Technical Market Outlook:
    The EUR/USD pair has bounced from the lows seen at the level of 1.0349 last week and continues to move higher. Currently, bulls had broken above the neutral market zone located between the levels of 1.0631 - 1.0654 and are trading inside the bullish zone. The strong and positive momentum support the short-term bullish outlook for Euro, however the ABC corrective cycle for bulls looks completed and the level of 1.0673 was the 100% Fibonacci extension for the up wave. If the bulls will continue higher, the next target is seen at 1.0731 (127% Fibonacci extension). The immediate technical support is located at 1.0654 and 1.0631 (the previous resistance).

    Weekly Pivot Points:
    WR3 - 1.0888
    WR2 - 1.0735
    WR1 - 1.0635
    Weekly Pivot - 1.0526
    WS1 - 1.0448
    WS2 - 1.0311
    WS3 - 1.0227

    Trading Outlook:
    The market is still in control by bears that pushed the price way below the level of 1.0639, so a breakout above this level is a must for bulls for a long-term trend reversal. The up trend can be continued towards the next long-term target located at the level of 1.1186 only if bullish cycle scenario is confirmed by breakout above the level of 1.0726, otherwise the bears will push the price lower towards the next long-term target at the level of 1.0336 or below.

    Analysis are provided byInstaForex.

    Read More
    Best regards, PR Manager
    Learn more about InstaForex Company at http://instaforex.com

  6. #1186
    Senior Member InstaForex Gertrude's Avatar
    Join Date
    Sep 2015
    Posts
    1,885
    Forex Analysis & Reviews: Forecast for EUR/USD on May 25, 2022

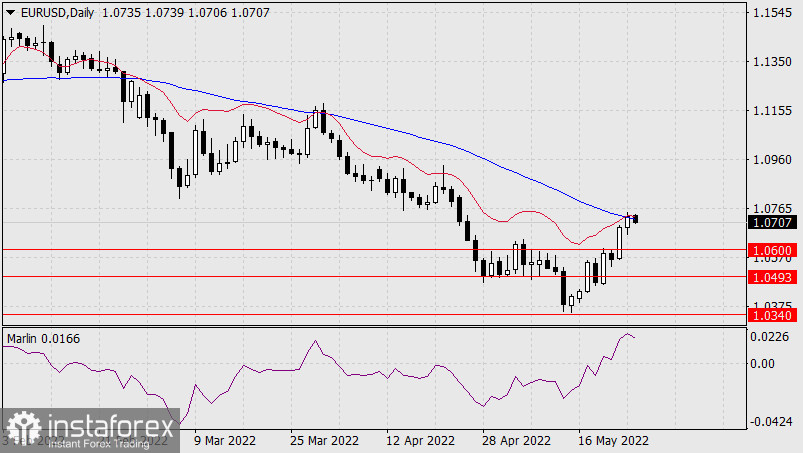
    Yesterday the euro chose to continue the correction with the full development of the MACD indicator line. The daily Marlin Oscillator is turning down, of course, a downside scenario is more likely. Targets for a decline are marked on the chart: 1.0600, 1.0493, 1.0340.


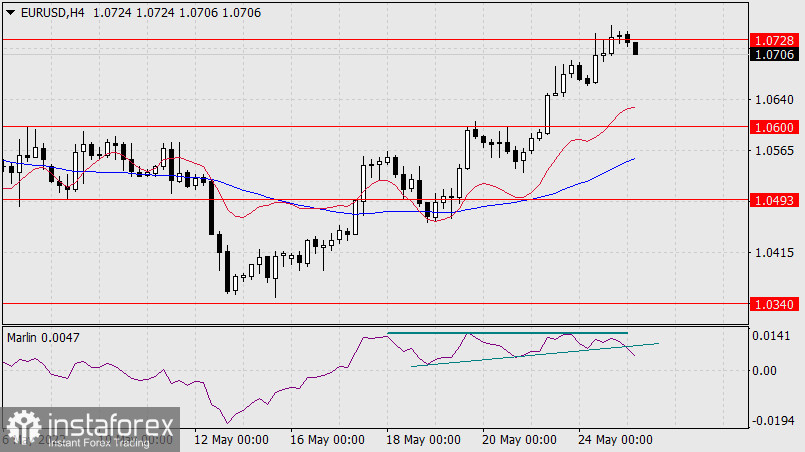
    The situation for the reversal looks even stronger on the four-hour chart: the price has formed a triple divergence with the Marlin Oscillator. At the same time, the signal line of the oscillator has formed a wedge, from which a downward breakthrough is already taking place. We are waiting for the price at the first target level of 1.0600.


    Analysis are provided byInstaForex.

    Read More
    Best regards, PR Manager
    Learn more about InstaForex Company at http://instaforex.com

  7. #1187
    Senior Member InstaForex Gertrude's Avatar
    Join Date
    Sep 2015
    Posts
    1,885
    Forex Analysis & Reviews: Forecast for EUR/USD on May 26, 2022

    The euro fell by 57 points on Wednesday. The daily candle has covered (engulfed) the white candle of Tuesday, which is one of the signs of a downward trend reversal. At the moment, the price is trying to grow, but it is being held by the balance (red) and MACD (blue) indicator lines. The Marlin Oscillator is turning down. The bears' goals remain the same: 1.0600, 1.0493, 1.0340.


    The downward direction has not yet gained a foothold on the H4 chart. The leading Marlin Oscillator penetrated into negative territory yesterday, but did not settle on it on the first attempt. A significant signal of reaching the first target at 1.0600 will be when the price overcomes yesterday's low at 1.0642. The MACD line is just below the level of 1.0600, which strengthens it, so you should wait for the price to settle below it in order to carry out trading strategies with the euro target at 1.0493.


    Analysis are provided byInstaForex.

    Read More
    Best regards, PR Manager
    Learn more about InstaForex Company at http://instaforex.com

  8. #1188
    Senior Member InstaForex Gertrude's Avatar
    Join Date
    Sep 2015
    Posts
    1,885
    Forex Analysis & Reviews: Forecast for EUR/USD on May 27, 2022

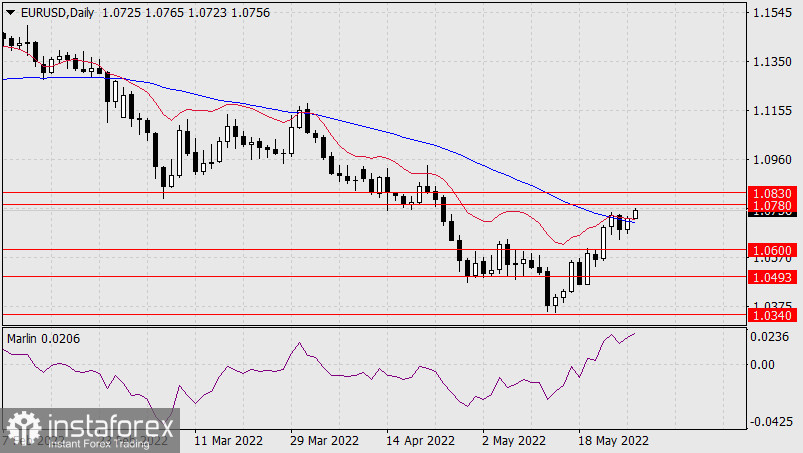
    Last night, the euro made a desperate attempt to break above the resistance of the MACD indicator line, and this morning it succeeded. The desperation of the moment is that yesterday's daily trading volumes were the lowest for the month. True, there was a holiday in Switzerland, but the price still needs to do a lot to strengthen the medium-term growth. At the first stage, the price should settle above the MACD line, that is, the day should be closed with a white candle. The nearest targets in this case will be the levels 1.0780 and 1.0830.


    In the current situation, the Marlin Oscillator on the daily scale does not share the price's optimism, so it is worth waiting for the price's reaction at the target levels.

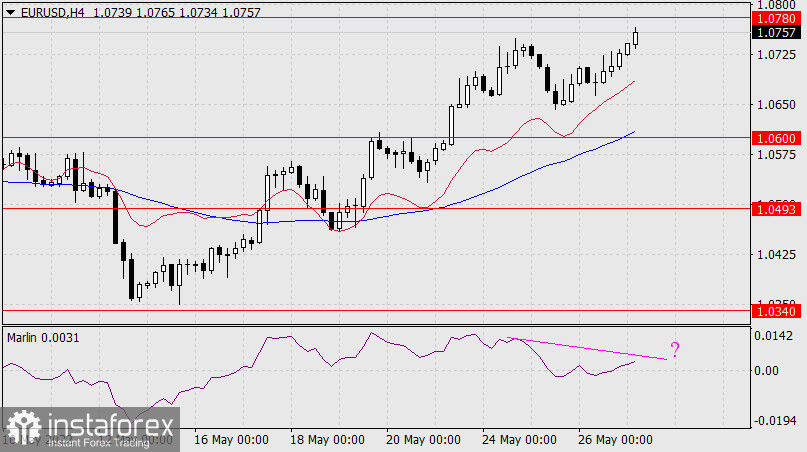
    Marlin also does not share the price's optimism on the four-hour chart, there are early signs of the formation of a divergence, and in order to overcome it, the price needs to move noticeably higher.


    At the moment, the strategically correct decision will be to wait for today's uncertainty.

    Analysis are provided byInstaForex.

    Read More
    Best regards, PR Manager
    Learn more about InstaForex Company at http://instaforex.com

  9. #1189
    Senior Member InstaForex Gertrude's Avatar
    Join Date
    Sep 2015
    Posts
    1,885
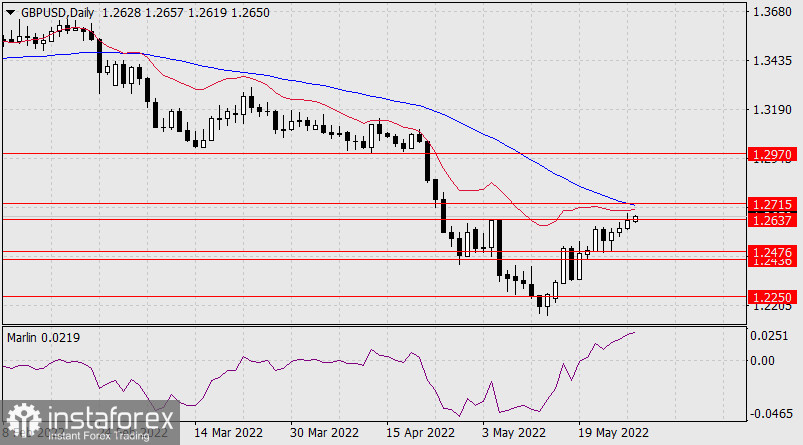
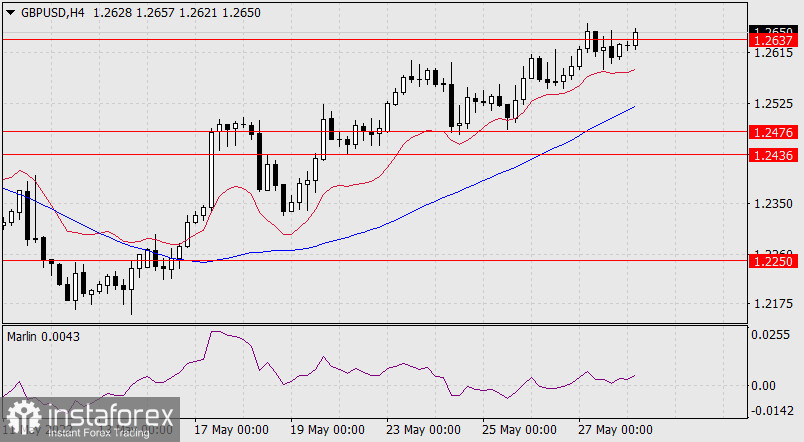
    Forex Analysis & Reviews: Forecast for GBP/USD on May 30, 2022

    On the daily chart, the price has moved above the target level of 1.2637 with the rising Marlin Oscillator. Ahead of it is the target level of 1.2715. The MACD line is now below this level, but the price may slightly go above it even if it plans to turn down later. If the price consolidates above this level, then the growth may last up to 1.2970 - the path will become open.


    On the four-hour chart, the price develops growth above the balance indicator line. The Marlin Oscillator turned up without reaching the border of the bears' territory. The rising trend is strong.


    Analysis are provided byInstaForex.

    Read More
    Best regards, PR Manager
    Learn more about InstaForex Company at http://instaforex.com

  10. #1190
    Senior Member InstaForex Gertrude's Avatar
    Join Date
    Sep 2015
    Posts
    1,885
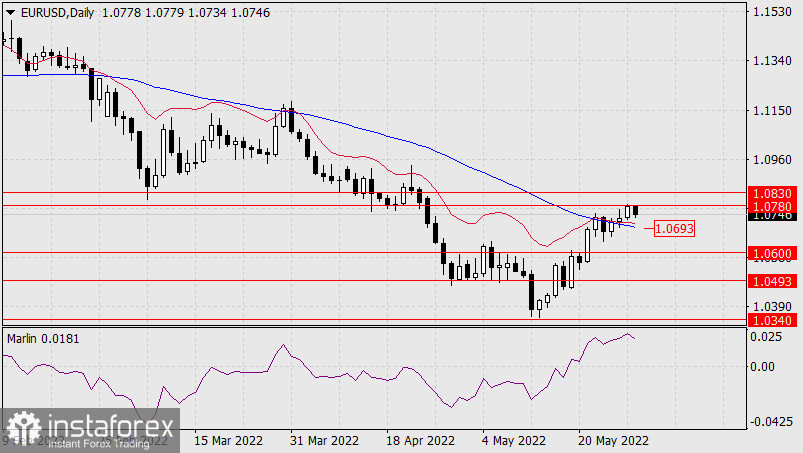
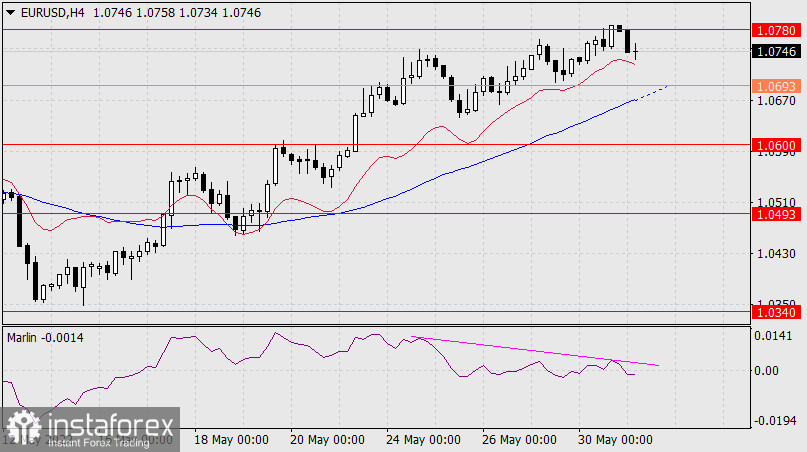
    Forex Analysis & Reviews: Forecast for EUR/USD on March 31, 2022

    Following the plan we described yesterday, the euro reached the target level of 1.0780 and turned down from it. The daily Marlin Oscillator supports this reversal. Now our attention is on the MACD indicator line (1.0693) – if the price overcomes it, then we can aim for the 1.0600 target. If the price does not overcome that level, then it may turn around to reach a higher level at 1.0830.


    On the H4 chart, the price divergence with the oscillator has changed somewhat over the past day, but retains its influence. The signal line of the oscillator is in negative territory again. The MACD line here almost coincides with the MACD line on a daily scale. The 1.0693 level is of particular importance due to the coincidence of the indicator of different timeframes on it. As a result, the probability of working off 1.0600 with the price going lower, to the levels of 1.0493 and 1.0340, increases.


    Analysis are provided byInstaForex.

    Read More
    Best regards, PR Manager
    Learn more about InstaForex Company at http://instaforex.com

Page 119 of 180 FirstFirst ... 19 69 109 117 118 119 120 121 129 169 ... LastLast

Tags for this Thread

Bookmarks

Posting Permissions

  • You may not post new threads
  • You may not post replies
  • You may not post attachments
  • You may not edit your posts
  •