
 6Likes
 LinkBack URL
 About LinkBacks


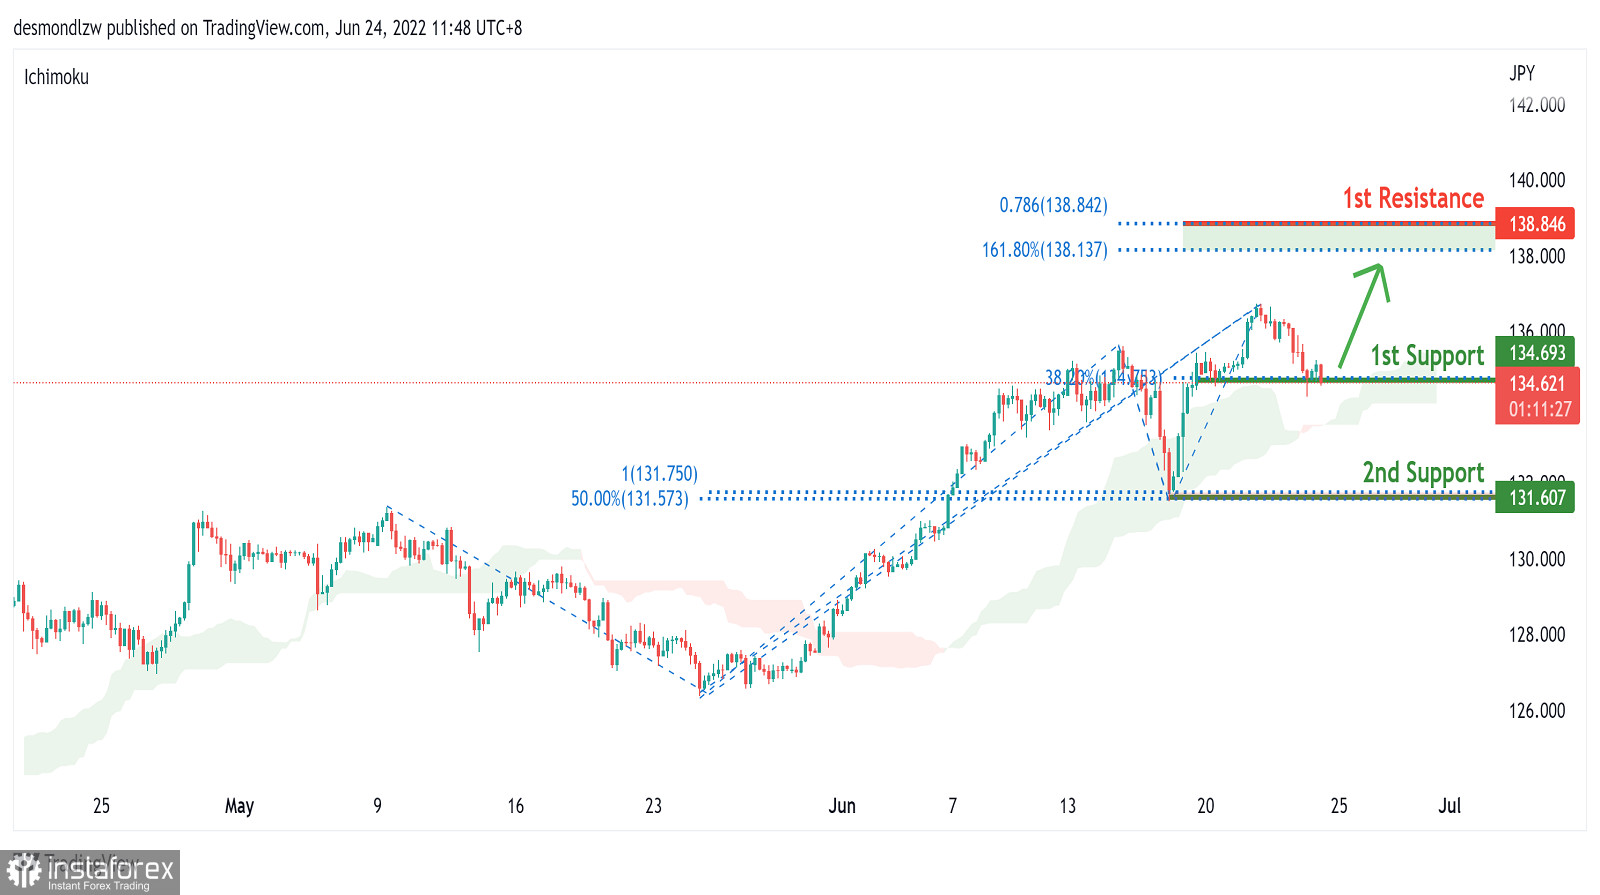
Forex Analysis & Reviews: Forecast for USD/JPY on June 17, 2022
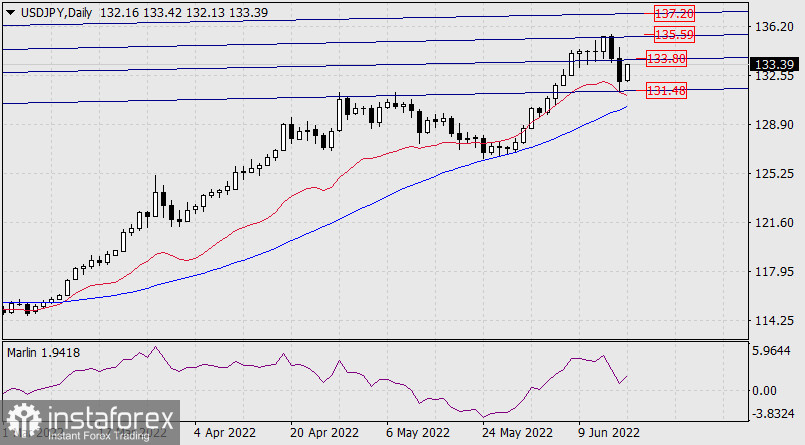
For the last two days, Wednesday and Thursday, the yen corrected after a strong growth since the final days of May. The correction ended at the embedded price channel line at 131.48. The Marlin Oscillator has not left the positive area, which confirms the corrective nature of the decline.
In today's Asian session the pair is trying to go over the resistance of the upper sloping line at 133.80 as soon as possible. If it succeeds, then the target opens at 135.59 (high on June 15), then 137.20.
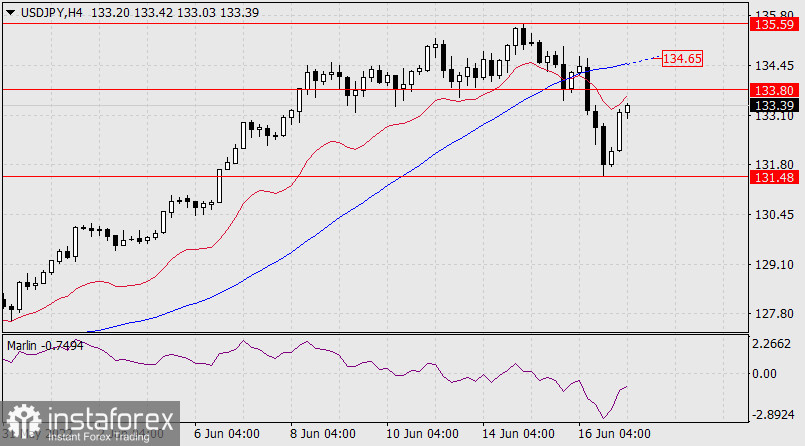
On the 4-hour chart, the price had a good momentum before attacking 133.80, and above this level there is the MACD line (134.65), which needs to be overcome before the key event of the transition above 135.59. The Marlin Oscillator has not yet left the downward trend, it needs to do so as soon as possible, because without the help of the oscillator, the price may not move above the MACD line. The main scenario is rising.
Analysis are provided byInstaForex.
Read More


 Reply With Quote


Bookmarks