Page 21 of 177 FirstFirst ... 11 19 20 21 22 23 31 71 121 ... LastLast
Results 201 to 210 of 1766

Wave Analysis by InstaForex

This is a discussion on Wave Analysis by InstaForex within the Analytics and News forums, part of the Trading Forum category; Technical analysis of Gold for May 21, 2018 Gold price is breaking down below the recent $1,285-$1,295 consolidation. Gold price ...


  1. #201
    Senior Member InstaForex Gertrude's Avatar
    Join Date
    Sep 2015
    Posts
    1,885
    Technical analysis of Gold for May 21, 2018

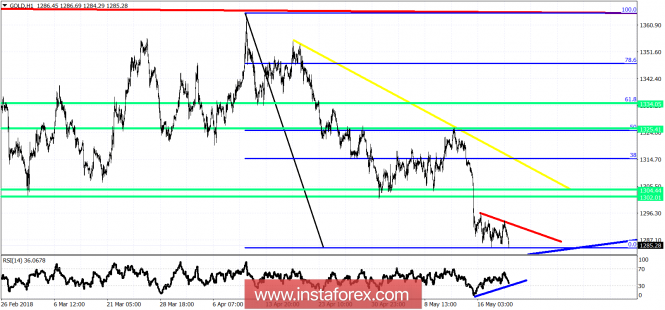
    Gold price is breaking down below the recent $1,285-$1,295 consolidation. Gold price could see $1,270-75, but the bearish divergence signs continue to warn us that the next big move will be to the upside. I'm a buyer of Gold at the current or lower levels.


    Blue lines - bullish divergence warning
    Green lines - target levels
    Yellow line - medium-term resistance
    Red line - short-term resistance

    Short-term resistance is at $1,292. I expect Gold price to soon break above it and move towards our first targets of $1,302-$1,304. Next important resistance is at $1,310-13 where I can see the next big trend test. With a break above this level, the price will move towards the 50% and 61.8% Fibonacci retracement. A weekly close above the 61.8% Fibonacci retracement will open the way for a bigger move towards $1,425. Gold is at its final stages of the move from the $1,365 level.

    Analysis are provided byInstaForex.
    Best regards, PR Manager
    Learn more about InstaForex Company at http://instaforex.com

  2. #202
    Senior Member InstaForex Gertrude's Avatar
    Join Date
    Sep 2015
    Posts
    1,885
    Pound returns to politics

    Quotes of the GBP/USD slumped to a five-month low as it came under fire on three sides. The lack of a unified position within the conservative party on the basic principles of Brexit has revived political risks, negative statistics on the U.K. continues to reduce the likelihood of tightening the monetary policy of the Bank of England in 2018, and, finally, the unrestrained growth of the yield of Treasury bonds pushes up the US dollar. Such an unfavorable background makes the position of the sterling extremely vulnerable, but Forex is good because the situation can be turned upside down in a matter of moments.

    Unexpected comments by Theresa May that Britain will still come out of the Customs Union, became a verdict for the pound. A week ago, the market was walking directly opposite rumors, which at that time had some support for the "bulls" on the GBP/USD. Even for a little while. The Prime Minister said that there is no reason for a second referendum on Scotland's independence, although in the North of the United Kingdom there are quite different sentiments. In general, the divide is felt in all politics, not only in the conservative party, which plays against sterling.

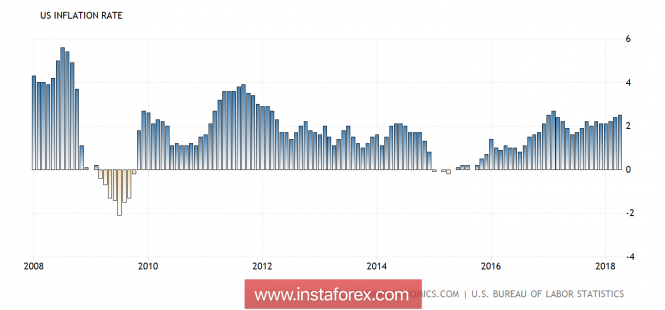
    The futures market is on the verge of abandoning the idea of raising the REPO rate by 25 bp in 2018. Previously, there was confidence in two acts of monetary tightening, and after the May meeting of the Bank of England, the likelihood of a hike in August were regarded as a fifty-fifty. However, the busy economic calendar for the week to May 25 a priori nominates the pound for the title of the most interesting currency of the five-day period. Bloomberg analysts expect to see April inflation and GDP for the first quarter at the same levels of +2.5% yoy and +0.1% q/q, and also forecast a slowdown in retail sales to a six-month low. At the same time, the BoE in its most recent accompanying documents noted that the second assessment of January-March, in fact, is likely to be the best. If inflation also begins to move away from the target in the direction of 3%, the idea of two acts of monetary tightening in 2018 will rise from the ashes. And if so, then the "bulls" on the GBP/USD after long ordeals will still feel the ground beneath their feet.

    Dynamics of the British inflation


    The reason for their optimism can be slowed down and finally, the US dollar. Despite the fact that the news of a truce in the trade war between Beijing and Washington in the form of a temporary cancellation of tariffs for $150 billion imports has benefited the yield of Treasury bonds, however, Bloomberg's median forecast of 3.19% at the end of the year is already close, and the stabilization of the indicator will somewhat curb the enthusiasm of bulls in the USD index. In addition, after a continuous 4-week rally, some of them will probably want to lock in the profit.

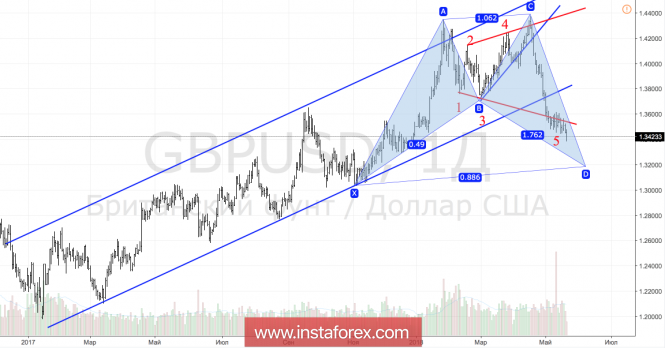
    Technically, a clear implementation of the "Broadening Wedge" pattern brought the pair's quotes beyond the upward trading channel, and the "bears" - to the operational space, and brought them closer to the target by 88.6% in the "Double Top" pattern at arm's length. It corresponds to the level of 1.32.

    GBP/USD daily chart


    *The market analysis posted here is meant to increase your awareness, but not to give instructions to make a trade.

    Analysis are provided byInstaForex.
    Best regards, PR Manager
    Learn more about InstaForex Company at http://instaforex.com

  3. #203
    Senior Member InstaForex Gertrude's Avatar
    Join Date
    Sep 2015
    Posts
    1,885
    Daily analysis of USDX for May 23, 2018

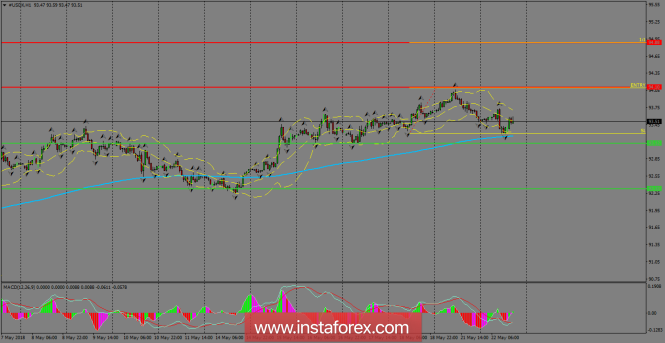
    The index managed to make a retracement from the Monday's highs, but the 200 SMA remains as a dynamic support in the short-term, where also it has formed a fractal. We should remind that a breakout above 94.10 can open the doors for a testing of the 94.88 level. However, a breakout below the 200 SMA on H1 chart should strengthen the bearish bias.


    H1 chart's resistance levels: 94.10 / 94.88
    H1 chart's support levels: 93.12 / 92.33

    Trading recommendations for today: Based on the H1 chart, place buy (long) orders only if the USD Index breaks with a bearish candlestick; the support level is at 94.10, take profit is at 94.88 and stop loss is at 93.30. *The market analysis posted here is meant to increase your awareness, but not to give instructions to make a trade.

    Analysis are provided byInstaForex.
    Best regards, PR Manager
    Learn more about InstaForex Company at http://instaforex.com

  4. #204
    Senior Member InstaForex Gertrude's Avatar
    Join Date
    Sep 2015
    Posts
    1,885
    Euro and pound fall due to weak data

    Data released in the first half of the day on the economy of the euro area and the UK exerted serious pressure on the euro and the British pound, allowing US dollar buyers to further increase their long positions before the publication of the Federal Reserve's protocols, from which many are waiting for signals in the direction of further interest rates .

    In the first quarter of this year, the unemployment rate in France rose, indicating a slowdown in the recovery of the euro-zone economy in 2018. According to the report of the statistics agency Insee, the unemployment rate in France in the first quarter of this year rose to 9.2% from 9.0% in the fourth quarter of last year. This happened because of a sharp slowdown in the economy earlier this year.

    The euro collapsed after a report came out indicating that the growth of business activity in the euro area in May this year, contrary to all forecasts of economists and ECB representatives, slowed for the fourth consecutive month.

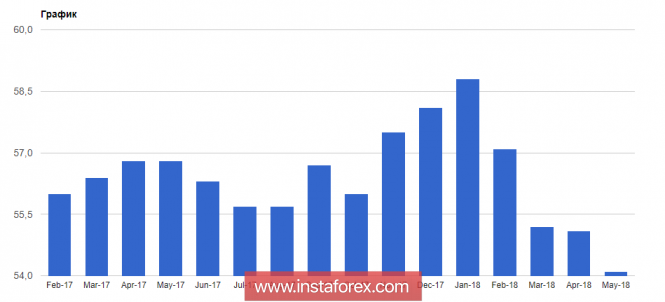
    According to a report by research company IHS Markit, the preliminary composite index of supply managers for the euro area in May 2018 was 54.1 points, while economists expected the index to be at 54.8 points.It is important to note that a value above 50 points still indicates an increase in activity.


    This slowdown is not surprising. For example, in Germany, the preliminary index of supply managers for the manufacturing sector in May fell to 56.8 points against 58.1 points in May, while it was projected at 57.5 points. The index for the service sector fell to 52.1 points in May against 53.0 points in April.

    In general, the composite PMI of Germany dropped to 53.1 points in May, while in April of this year, it was at the level of 54.6 points.

    France too, failed to please with good results.

    The preliminary composite index of supply managers of the PMI of France fell to 54.5 points in May against 56.9 points in April this year.

    As noted above, the British pound went to update the monthly lows paired with the US dollar after it became clear that the annual inflation in the UK in April this year dropped to the lowest level in more than a year.

    According to the National Bureau of Statistics, consumer prices rose only by 2.4% in April this year compared with the same period last year. In March, growth was at 2.5%.

    The main reason for the decline in prices, as noted in the ONS report, is the drop in prices for air tickets.

    All the data fully coincided with the forecast of economists.

    The reaction of the Bank of England, most likely, will not take long. In the near future, representatives of the Central Bank will make a number of statements, based on today's data, and most likely, they will not like the buyers of the British pound slightly.

    *The market analysis posted here is meant to increase your awareness, but not to give instructions to make a trade.

    Analysis are provided byInstaForex.
    Best regards, PR Manager
    Learn more about InstaForex Company at http://instaforex.com

  5. #205
    Senior Member InstaForex Gertrude's Avatar
    Join Date
    Sep 2015
    Posts
    1,885
    Elliott wave analysis of EUR/NZD for May 25, 2018


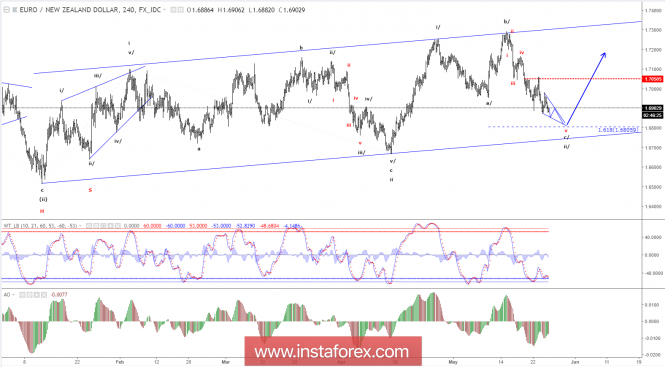
    EUR/NZD is now in its final stages of the wave c/ of ii/. Ideally, we will see a minor dip closer to support near 1.6806 before the wave ii/ is complete, but we would not be surprised to see a premature low form for a new rally higher through minor resistance at 1.6958 and, more importantly, above resistance at 1.7061 confirming that the wave iii/ higher to test important resistance at 1.7300 is developing.

    R3: 1.7061
    R2: 1.6981
    R1: 1.6958
    Pivot: 1.6915
    S1: 1.6883
    S2: 1.6846
    R3: 1.6806

    Trading recommendation: We are looking for a EUR-buying opportunity at 1.6815 or upon a break above 1.6960.

    Analysis are provided byInstaForex.
    Best regards, PR Manager
    Learn more about InstaForex Company at http://instaforex.com

  6. #206
    Senior Member InstaForex Gertrude's Avatar
    Join Date
    Sep 2015
    Posts
    1,885
    Trading Plan for EUR/USD for May 28, 2018


    Technical outlook:

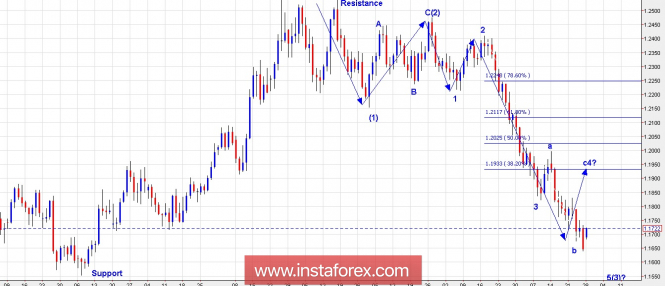
    The EUR/USD pair finally looks to stage a counter trend rally towards the 1.1950/1.2050 levels from here. In the immediate short term outlook, the pair should be looking to take out the 1.1750 levels, which is short term resistance. Then expect a dip towards the 1.1670/80 levels, before the counter trend rally gains further momentum higher. Please note that the 0.382 fibonacci resistance is seen at the 1.1940/50 levels as projected here. Immediate price support is seen at the 1.1500 levels, which should be the next potential target for bears. Now looking into the wave counts, the EUR/USD pair is still progressing into its 3rd wave of a lesser degree and is expected to carve the wave 4, before dropping lower into the wave 5 within the wave (3) as depicted here. Selling on rallies remains a preferred trading strategy for now.

    Trading plan:
    Aggressive traders may initiate longs around the 1.1675/1.1700 levels going forward; while conservative traders may remain flat for now and look forward to sell again between the 1.1930 and 1.2050 levels respectively.

    Fundamental outlook:
    There are no major events lined up for the day.

    Good luck!

    Analysis are provided byInstaForex.
    Best regards, PR Manager
    Learn more about InstaForex Company at http://instaforex.com

  7. #207
    Senior Member InstaForex Gertrude's Avatar
    Join Date
    Sep 2015
    Posts
    1,885
    Elliott wave analysis of EUR/JPY for May 29, 2018


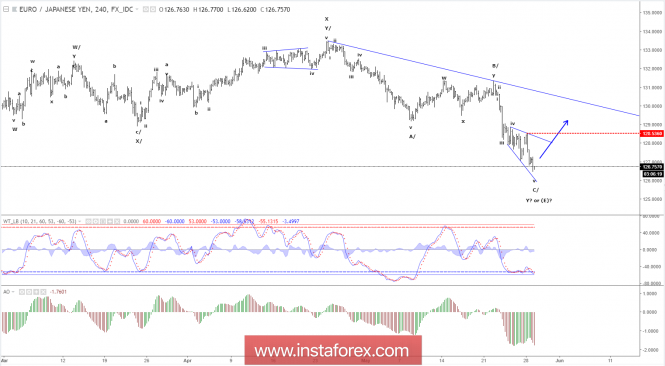
    The rally from 127.11 became much smaller than we expected and the following break back below 127.11 shifted our count back to the prior preferred count calling for a decline to 125.32 before a possible low of the wave C and (E) is in place.

    Short-term resistance is seen at 127.28 and a clear break back above here will be the first indication of a low being in place, but only a break above resistance at 128.54 will confirm that the wave (E) has bottomed and a new long-term rally is starting to develop.

    R3: 128.54
    R2: 127.71
    R1: 127.28
    Pivot: 126.93
    S1: 126.49
    S2: 125.80
    S3: 125.32

    Trading recommendation: We bought EUR at 127.75 and was stopped out shortly after for a loss of 70 pips. We are looking for a new EUR-buying opportunity, but for now we will only buy upon a break above 127.28.

    Analysis are provided byInstaForex.
    Best regards, PR Manager
    Learn more about InstaForex Company at http://instaforex.com

  8. #208
    Senior Member InstaForex Gertrude's Avatar
    Join Date
    Sep 2015
    Posts
    1,885
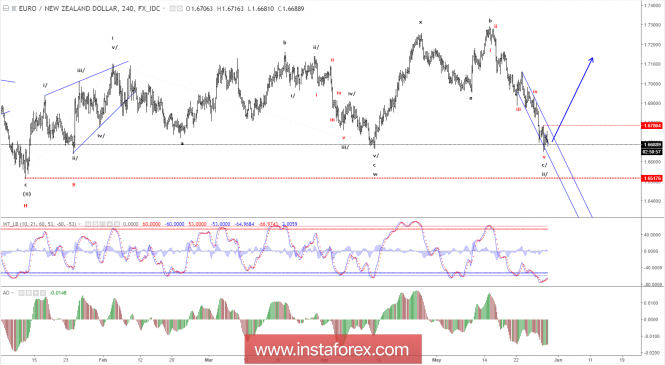
    Elliott wave analysis of EUR/NZD for May 30, 2018


    The break below the important support at 1.6670 was unexpected and has forced us to shift our long-term count. This new count still favors a bullish outlook, but sees a very complex corrective structure in the wave ii. From the peak of the wave i at 1.7099 in early February, a double corrective combination has been seen. First, a flat correction as the wave W and then a expanded flat as the wave Y to complete the wave ii. Either the wave ii is complete or very close to completing near after a final spike to just below 1.6653.

    In the short-term, a break above the minor resistance at 1.6786 and, more importantly, a break above 1.6903 will confirm that the wave ii has completed and a new impulsive rally in the wave iii is developing above 1.7300.

    R3: 1.6903
    R2: 1.6828
    R1: 1.6786
    Pivot: 1.6710
    S1: 1.6653
    S2: 1.6642
    S3: 1.6607

    Trading recommendation:
    Our stop at 1.6665 was triggered for a loss of 150 pips. We will be looking for a new buying opportunity, but waiting for a break above 1.6786.

    Analysis are provided byInstaForex.
    Best regards, PR Manager
    Learn more about InstaForex Company at http://instaforex.com

  9. #209
    Senior Member InstaForex Gertrude's Avatar
    Join Date
    Sep 2015
    Posts
    1,885
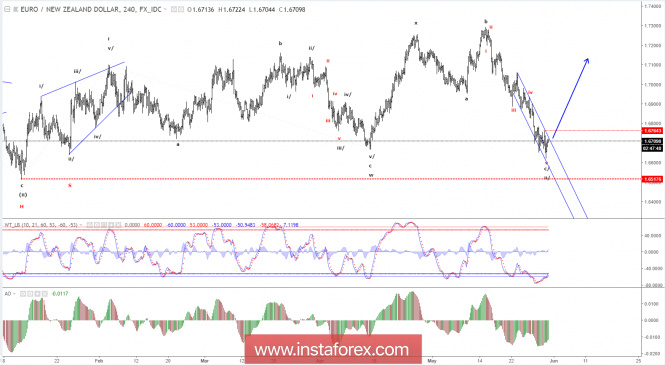
    Elliott wave analysis of EUR/NZD for May 31, 2018


    Wave ii/ likely saw a low with the test of 1.6624. We still need to see a break above the resistance-line near 1.6734 and more importantly a break above minor resistance at 1.6764 to add confidence in our view that a low likely is in place. As long as minor resistance at 1.6764 is able to cap the upside, we could still see another attack towards the downside, but the downside potential seems very limited from here.

    A break above minor resistance at 1.6764 will target the more important resistance at 1.7062 and above here will confirm that wave iii/ to above 1.7300 is developing.

    R3: 1.6903
    R2: 1.6829
    R1: 1.6764
    Pivot: 1.6705
    S1: 1.6683
    S2: 1.6656
    S3: 1.6624

    Trading recommendation:
    We will buy a break above minor resistance at 1.6764 and if done place our stop at 1.6620.

    Analysis are provided byInstaForex.
    Best regards, PR Manager
    Learn more about InstaForex Company at http://instaforex.com

  10. #210
    Member
    Join Date
    Sep 2015
    Posts
    94
    Technical analysis of USD/CAD for June 01, 2018


    Overview:

    Pivot: 1.2961.

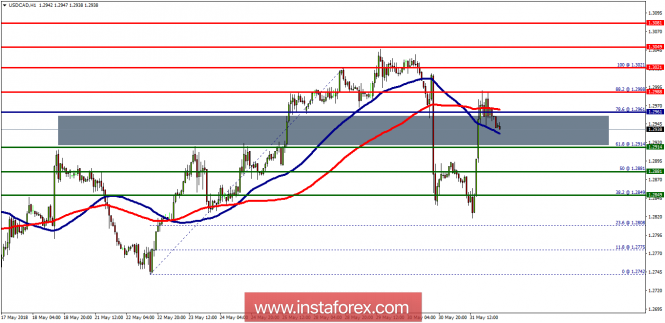
    The USD/CAD pair will continue to rise from the level of 1.2914. The support is found at the level of 1.2914, which represents the 61.8% Fibonacci retracement level on the H1 chart. The price is likely to form a double bottom. Today, the major support is seen at 1.2914, while immediate resistance is seen at 1.3021. Accordingly, the USD/CAD pair is showing signs of strength following a breakout of the high at 1.2914. So, buy above the level of 1.2914 with the first target at 1.3021 in order to test the daily resistance 1 and move further to 1.3049. Also, the level of 1.3049 is a good place to take profit because it will form a new double top. Amid the previous events, the pair is still in an uptrend; for that we expect the USD/CAD pair to climb from 1.2914 to 1.3049 today. At the same time, in case a reversal takes place and the USD/CAD pair breaks through the support level of 1.2914, a further decline to 1.2849 can occur, which would indicate a bearish market.

    *The market analysis posted here is meant to increase your awareness, but not to give instructions to make a trade.

Page 21 of 177 FirstFirst ... 11 19 20 21 22 23 31 71 121 ... LastLast

Tags for this Thread

Bookmarks

Posting Permissions

  • You may not post new threads
  • You may not post replies
  • You may not post attachments
  • You may not edit your posts
  •