Page 118 of 164 FirstFirst ... 18 68 108 116 117 118 119 120 128 ... LastLast
Results 1,171 to 1,180 of 1634

Wave Analysis by InstaForex

This is a discussion on Wave Analysis by InstaForex within the Analytics and News forums, part of the Trading Forum category; Forex Analysis & Reviews: Elliott wave analysis of Silver for May 3, 2022 Silver is testing support at 22.16 and ...


  1. #1171
    Senior Member InstaForex Gertrude's Avatar
    Join Date
    Sep 2015
    Posts
    1,885
    Forex Analysis & Reviews: Elliott wave analysis of Silver for May 3, 2022


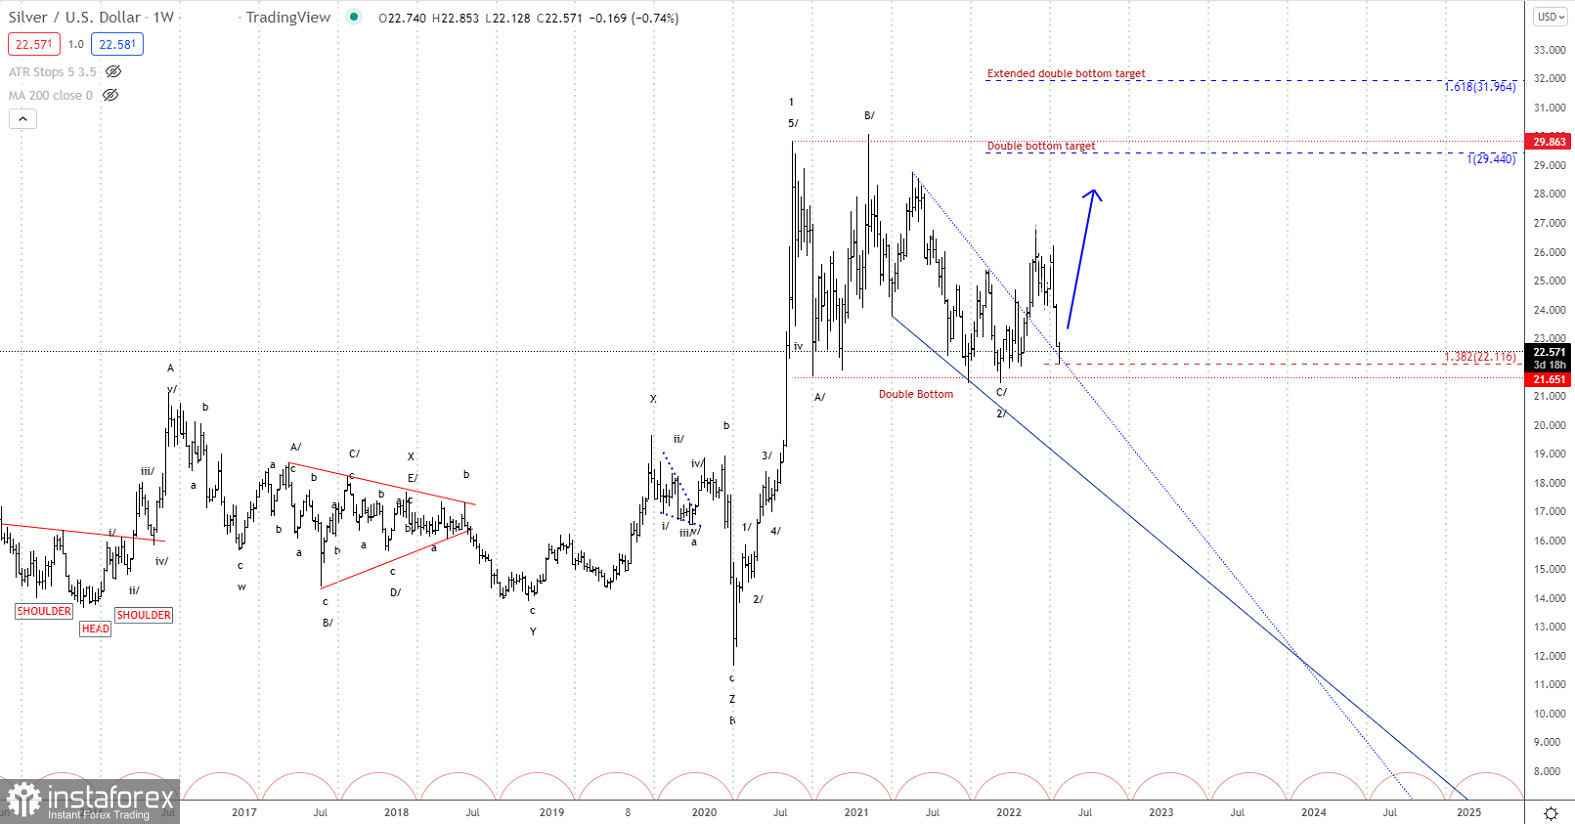
    Silver is testing support at 22.16 and could be ready for the next impulsive rally towards resistance at 30.00 and a break above here will release the energy for a continuation higher to the all-time high at 50.00. That said, if minor resistance at 23.56 is able to cap the upside, then silver could move closer to strong support near 21.65 before being ready to rally in the next impulsive move higher.

    So for now we need to stay flexible and observe the market behavior near 22.16 and more importantly near minor resistance at 23.56 as a break will indicate the correction is complete and the next rally towards 30.00 is in motion.

    Analysis are provided byInstaForex.
    Best regards, PR Manager
    Learn more about InstaForex Company at http://instaforex.com

  2. #1172
    Senior Member InstaForex Gertrude's Avatar
    Join Date
    Sep 2015
    Posts
    1,885
    Forex Analysis & Reviews: USDJPY, Potential for Bullish Continuation | 4th May 2022


    On the H4, with price moving above the Ichimoku cloud, we have a bullish bias that price will rise to our 1st resistance at 131.240 where the swing high resistance is from our 1st support at 129.374 in line with the horizontal pullback support and 50% and 78.6 Fibonacci retracement. Alternatively, price may break 1st support structure and head for 2nd support at 127.240 where the horizontal swing low support is.

    Trading Recommendation
    Entry: 129.374
    Reason for Entry:
    Horizontal pullback support and 50% and 78.6 Fibonacci retracement
    Take Profit:131.240
    Reason for Take Profit: Horizontal swing high resistance
    Stop Loss: 127.240
    Reason for Stop Loss:
    Horizontal swing low support

    Analysis are provided byInstaForex.
    Best regards, PR Manager
    Learn more about InstaForex Company at http://instaforex.com

  3. #1173
    Senior Member InstaForex Gertrude's Avatar
    Join Date
    Sep 2015
    Posts
    1,885
    Forex Analysis & Reviews: Forecast for EUR/USD on May 5, 2022

    As a result of yesterday's Federal Reserve meeting, investors decided to postpone a large-scale attack on counter-dollar assets. The reason for this decision was a slight slowdown by the Fed in the pace of balance sheet reduction: the markets expected that the central bank would immediately reduce the balance sheet at a rate of $95 billion per month, but it was decided to start with $47.5 billion per month, bringing the forecast rate to $95 billion. billion in three months. The rate, as expected, was increased by 0.50%. An increase of 0.50% was also announced for the next meeting in June.

    The euro rose by 103 points, but we do not expect this momentum to develop. On Friday, the data on employment in the US is expected to reduce unemployment from 3.6% to 3.5%. As before, the euro has little cause for optimism, we just have to wait for the technical signs of a recovery in the strengthening of the dollar.


    The price is in a downward trend on the daily chart – the Marlin Oscillator is in the negative area. If there are no new surprises, then Marlin will not enter the zone of positive values.


    The situation is growing on the four-hour scale. To change the trend, at least one condition must be fulfilled: the price should fall under the MACD line (1.0556), the transition of the Marlin Oscillator to the negative area. Apparently, this will happen tomorrow.

    Analysis are provided byInstaForex.
    Best regards, PR Manager
    Learn more about InstaForex Company at http://instaforex.com

  4. #1174
    Senior Member InstaForex Gertrude's Avatar
    Join Date
    Sep 2015
    Posts
    1,885
    Forex Analysis & Reviews: Technical Analysis of EUR/USD for May 6, 2022


    Technical Market Outlook
    The EUR/USD pair bounce had been capped at the level of 1.0636 after the Pin Bar candlestick pattern was made at the H4 time frame chart. The oversold market conditions on the Daily time frame chart, indicate the down trend continues and there is no indication of trend termination or reversal just yet. The nearest technical support is located at 1.0469. The bearish market border is located at 1.0755, so there is still a room for bears to try to resume the down trend.

    Weekly Pivot Points:
    WR3 - 1.1064
    WR2 - 1.0933
    WR1 - 1.0710
    Weekly Pivot - 1.0591
    WS1 - 1.0363
    WS2 - 1.0252
    WS3 - 1.0032

    Trading Outlook:
    The market is still in control by bears that pushed the price way below the level of 1.1185, so a breakout above this level is a must for bulls for a long-term trend reversal. The up trend can be continued towards the next long-term target located at the level of 1.1494 (high from 06.02.2022) only if bullish cycle scenario is confirmed by breakout above the level of 1.1186 and 1.1245, otherwise the bears will push the price lower towards the next long-term target at the level of 1.0336 or below.

    Analysis are provided byInstaForex.
    Best regards, PR Manager
    Learn more about InstaForex Company at http://instaforex.com

  5. #1175
    Senior Member InstaForex Gertrude's Avatar
    Join Date
    Sep 2015
    Posts
    1,885
    Forex Analysis & Reviews: Elliott wave analysis of GBP/JPY for May 9, 2022


    We see a should/Head/Should top building and the neckline support currently sitting near 159.63 a clear break below the neckline support will call for a continuation lower towards support at 157.96 and 154.14 as the next downside targets.

    The neckline support should not be to difficult to break confirming the top and the continuation of wave C lower towards support near 134.14 and possibly even lower towards the 50% target at 150.09.

    Analysis are provided byInstaForex.
    Best regards, PR Manager
    Learn more about InstaForex Company at http://instaforex.com

  6. #1176
    Senior Member InstaForex Gertrude's Avatar
    Join Date
    Sep 2015
    Posts
    1,885
    Forex Analysis & Reviews: GBPUSD Potential for Bearish Continuation | 10th May 2022


    On the H4, with price moving below the Ichimoku cloud, we have a bearish bias that price will drop from our 1st resistance at 1.24080 where the 38.2% Fibonacci retracement and pullback resistance is to our 1st support at 1.22677 in line with the 161.8% Fibonacci extension and horizontal swing low support is. Alternatively, price may break 1st resistance structure and head for 2nd resistance at 1.24802 in line with the 61.8% Fibonacci retracement.

    Trading Recommendation
    Entry: 1.24080
    Reason for Entry:
    38.2% Fibonacci retracement and pullback resistance
    Take Profit:1.22677
    Reason for Take Profit:161.8% Fibonacci extension and horizontal swing low support
    Stop Loss: 1.24802
    Reason for Stop Loss:
    61.8% Fibonacci retracement and horizontal pullback support

    Analysis are provided byInstaForex.
    Best regards, PR Manager
    Learn more about InstaForex Company at http://instaforex.com

  7. #1177
    Senior Member InstaForex Gertrude's Avatar
    Join Date
    Sep 2015
    Posts
    1,885
    Forex Analysis & Reviews: GBPUSD Potential for Bearish Continuation | 11th May 2022


    On the H4, with price moving below the Ichimoku cloud, we have a bearish bias that price will drop from our 1st resistance at 1.24080 where the 38.2% Fibonacci retracement and pullback resistance is to our 1st support at 1.22677 in line with the 161.8% Fibonacci extension and horizontal swing low support is. Alternatively, price may break 1st resistance structure and head for 2nd resistance at 1.24802 in line with the 61.8% Fibonacci retracement.

    Trading Recommendation
    Entry: 1.24080
    Reason for Entry:
    38.2% Fibonacci retracement and pullback resistance
    Take Profit:1.22677
    Reason for Take Profit:161.8% Fibonacci extension and horizontal swing low support
    Stop Loss: 1.24802
    Reason for Stop Loss:
    61.8% Fibonacci retracement and horizontal pullback support

    Analysis are provided byInstaForex.
    Best regards, PR Manager
    Learn more about InstaForex Company at http://instaforex.com

  8. #1178
    Senior Member InstaForex Gertrude's Avatar
    Join Date
    Sep 2015
    Posts
    1,885
    Forex Analysis & Reviews: Forecast for EUR/USD on May 12, 2022

    Yesterday, the euro decided neither to actively rise nor to decline. The price continues to consolidate above the support level of 1.0493. The price drop below this level opens the target range of 1.0340/65. The reference point for its lower boundary is the January 2017 low. Yesterday's fall in stock markets (S&P 500 -1.65%), caused by persistently high inflation (monthly CPI growth for April is shown at 0.3%, and the decrease in annual pressure from 8.5% to 8.3%) completely deprives investors of interest to risk. As a result, the probability of the euro falling to the lower border of the price channel with an attempt to overcome it increases.


    The price is on the MACD line on the four-hour chart, which so far shows its neutral state, but at the same time, it is below the balance line and the Marlin Oscillator is in the negative area.


    Analysis are provided byInstaForex.
    Best regards, PR Manager
    Learn more about InstaForex Company at http://instaforex.com

  9. #1179
    Senior Member InstaForex Gertrude's Avatar
    Join Date
    Sep 2015
    Posts
    1,885
    Forex Analysis & Reviews: Forecast for GBP/USD on May 13, 2022

    Yesterday the pound broke through the target level of 1.2250, now it is hardly moving towards the next support at 1.2073 (May 2020 low). The difficulty is created by the convergence with the Marlin Oscillator on the daily scale. However, the convergence is not pronounced, it can be easily broken and lose its already weak appearance.


    There is also a slight divergence on the four-hour chart, the signal line of the Marlin Oscillator is consolidating in the range rather than trying to indicate the trend's potential. The most likely development in the current conditions is a gradual decline to the target level of 1.2073 under the MACD line, as it has been for the last week.


    Analysis are provided byInstaForex.
    Best regards, PR Manager
    Learn more about InstaForex Company at http://instaforex.com

  10. #1180
    Senior Member InstaForex Gertrude's Avatar
    Join Date
    Sep 2015
    Posts
    1,885
    Forex Analysis & Reviews: Elliott wave analysis of Crude Oil for May 17, 2022


    Crude oil has just completed a symmetric triangle to the upside which calls for the next impulsive rally towards at least 134.34 and more likely closer to 159.94. If we see a runaway rally in wave 5, we could even see crude oil reach the 200 handle.

    Short-term we see minor resistance near 116.64 before running higher for a test of the 134.34 target.

    Analysis are provided byInstaForex.
    Best regards, PR Manager
    Learn more about InstaForex Company at http://instaforex.com

Page 118 of 164 FirstFirst ... 18 68 108 116 117 118 119 120 128 ... LastLast

Tags for this Thread

Bookmarks

Posting Permissions

  • You may not post new threads
  • You may not post replies
  • You may not post attachments
  • You may not edit your posts
  •