Page 72 of 180 FirstFirst ... 22 62 70 71 72 73 74 82 122 172 ... LastLast
Results 711 to 720 of 1795

Wave Analysis by InstaForex

This is a discussion on Wave Analysis by InstaForex within the Analytics and News forums, part of the Trading Forum category; Technical Analysis of GBP/USD for July 20, 2020: Technical Market Outlook: The GBP/USD pair has been seen trading inside of ...


  1. #711
    Senior Member InstaForex Gertrude's Avatar
    Join Date
    Sep 2015
    Posts
    1,885
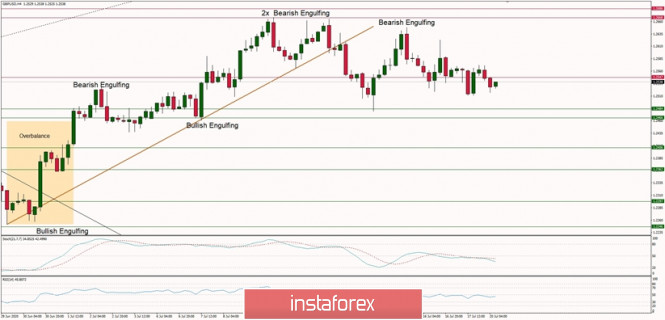
    Technical Analysis of GBP/USD for July 20, 2020:

    Technical Market Outlook:
    The GBP/USD pair has been seen trading inside of the narrow consolidation zone located between the levels of 1.2482 - 1.2668 for all the last week and nothing has changed yet. The volatility has decreased and the momentum is hovering around the level of fifty, so no clues from this indicator either. Only a sustained breakout above of below certain level can provide a clue regarding the next market move.

    Weekly Pivot Points:
    WR3 - 1.2834
    WR2 - 1.2735
    WR1 - 1.2648
    Weekly Pivot - 1.2555
    WS1 - 1.2463
    WS2 - 1.2373
    WS3 - 1.2271

    Trading Recommendations:
    On the GBP/USD pair the main trend is down, which can be confirmed by the down candles on the weekly time frame chart. The key long-term technical support has been recently violated (1.1983) and the new one is seen at the level of 1.1404. The key long-term technical resistance is seen at the level of 1.3518. Only if one of these levels is clearly violated, the main trend might reverse (1.3518) or accelerate (1.1404). The market might have done a Double Top pattern at the level of 1.2645, so the price might move even lower in the longer-term.


    Analysis are provided byInstaForex.
    Best regards, PR Manager
    Learn more about InstaForex Company at http://instaforex.com

  2. #712
    Senior Member InstaForex Gertrude's Avatar
    Join Date
    Sep 2015
    Posts
    1,885
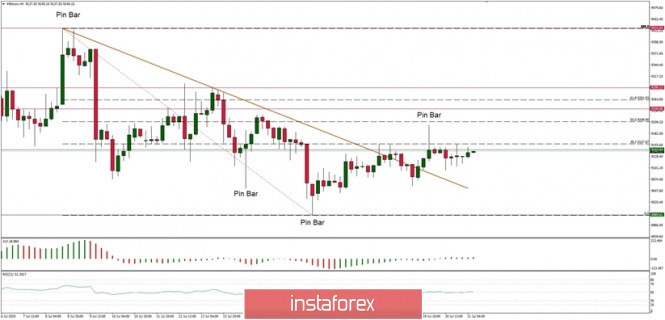
    Technical Analysis of BTC/USD for July 21, 2020:

    Crypto Industry News:
    The underground of the Internet, or darknet, is that part of the web that is beyond the reach of traditional browsers and search engines. There are tons of digital markets in this network where all kinds of illegal goods are traded and paid for with cryptocurrencies.

    In a State of Crypto Crimes report released earlier this year, blockchain analyst Chainalysis investigated crimes committed using cryptography, among them darknet transactions, which were the most consistent. In 2019, revenues from online underground markets hit a new record of $ 790 million.

    While indicators on all financial fronts for these markets are rising, one aspect that remains much more consistent is the choice of cryptocurrency.

    "The most popular cryptocurrency used by the darknet is Bitcoin," said Kim Grauer, head of research, and Carles Lopez-Penalver, senior cybercrime analyst at Chainlysis.

    Among the altcoins used are Litecoin, Bitcoin Cash, and Monero. Even though only one of the three cryptos listed above has privacy features, the popular altcoins are widely used. However, some markets have seen exclusive use of Monero because of its encrypted web features, Chainalysis management said.

    Altcoins are even more distant as operations grow in size and scale. According to Bitfury's Crystal Blockchain report, in the first quarter of 2020, darknet entities received more than $ 384 million in Bitcoin and more than $ 411 million was sent, where the recipients of these transactions are exchanges divided between those that have verification requirements and those that do not.

    Unlike high-value Bitcoin transactions, Grauer and Lopez-Penalver added that altcoins are only used for smaller darknet transactions.

    Technical Market Outlook:
    The BTC/USD pair has been trading around the 38% Fibonacci retracement of the last wave down that is located at the level of $9,157. The bears had pushed the price down from the local high made at the level of $9,201, but the price did not come back under the short-term trend line. The momentum remains neutral which indicates another sideways day. The next targets for bulls are seen at the levels of $9,209 and $9,261. The nearest technical support is located at $9,095.

    Weekly Pivot Points:
    WR3 - $9,569
    WR2 - $9,411
    WR1 - $9,271
    Weekly Pivot - $9,117
    WS1 - $8,968
    WS2 - $8,812
    WS3 - $8,862

    Trading Recommendations:
    The volatility on Bitcoin has been subdued for more than two months now, so the larger time frame trend remains down and as long as the level of $10,791 is not violated, all rallies will be treated as a counter-trend corrective moves. This is why the short positions are now more preferred until the level of $10,791 is clearly violated. The key mid-term technical support is located at the level of $7,897.


    Analysis are provided byInstaForex.
    Best regards, PR Manager
    Learn more about InstaForex Company at http://instaforex.com

  3. #713
    Senior Member InstaForex Gertrude's Avatar
    Join Date
    Sep 2015
    Posts
    1,885
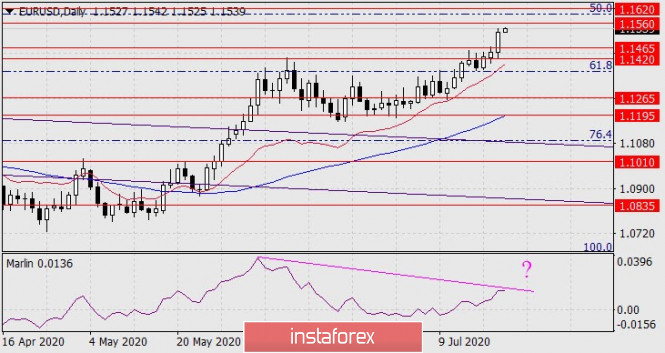
    Forecast for EUR/USD on July 22, 2020

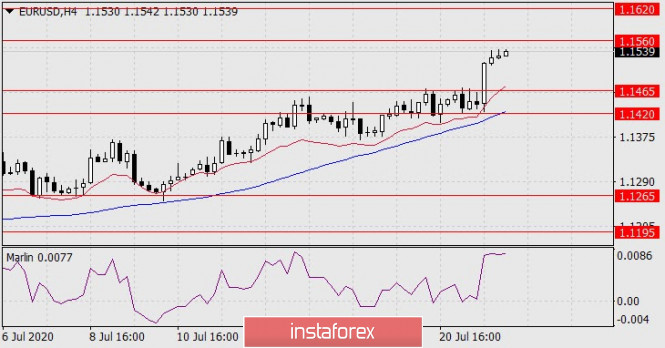
    EUR/USD The euro rose by 78 points yesterday due to information that the 750 billion euro fund for the EU's recovery from coronavirus has finally been created. The momentum that the euro received could still grow towards the yet-to-be-reached target of 1.1560, possibly to 1.1620, but along with the fading news itself and local market overheating, which is signaled by the Marlin oscillator forming a divergence with the price, a subsequent reversal of the euro down into the range of 1.195-1.1265 is likely.


    The price is growing above the balance and MACD lines on the H4 chart, the Marlin oscillator is actively growing and is close to overbought.

    The current situation in the euro is such that it is no longer advisable to buy, and too early to sell. Even if we assume the option with a further medium-term rise of the single currency, it is better to wait for the price to pull back, which will occur, at least, in the range of 1.1420/65.


    Analysis are provided byInstaForex.
    Best regards, PR Manager
    Learn more about InstaForex Company at http://instaforex.com

  4. #714
    Senior Member InstaForex Gertrude's Avatar
    Join Date
    Sep 2015
    Posts
    1,885
    European Economics Preview: Germany GfK Consumer Confidence Data Due


    Consumer confidence from Germany is due on Thursday, headlining a light day for the European economic news.

    At 2.00 am ET, Germany's Gfk consumer confidence survey results are due. The forward-looking consumer sentiment index is expected to rise to -5 in August from -9.6 in July.

    In the meantime, unemployment data is due from Statistics Norway. At 2.45 am ET, the statistical office Insee is scheduled to release France's business confidence survey data. Economists forecast the index to climb to 85 in July from 77 in June.

    At 3.30 am ET, Statistics Sweden publishes unemployment data for June.

    Half an hour later, unemployment data is due from Poland. The jobless rate is seen at 6.2 percent in June versus 6 percent in May.

    At 6.00 am ET, the Confederation of British Industry is slated to issue Industrial Trends survey data. The order book balance is forecast to improve to -38 in July from -58 in June.

    At 7.00 am ET, Turkey's central bank is set to announce its interest rate decision. The bank is expected to hold its one-week repo rate at 8.25 percent.

    At 10.00 am ET, Eurozone flash consumer confidence survey data is due. The sentiment index is seen rising to -12 in July from -14.7 in June.

    News are provided by
    InstaForex
    .
    Best regards, PR Manager
    Learn more about InstaForex Company at http://instaforex.com

  5. #715
    Senior Member InstaForex Gertrude's Avatar
    Join Date
    Sep 2015
    Posts
    1,885
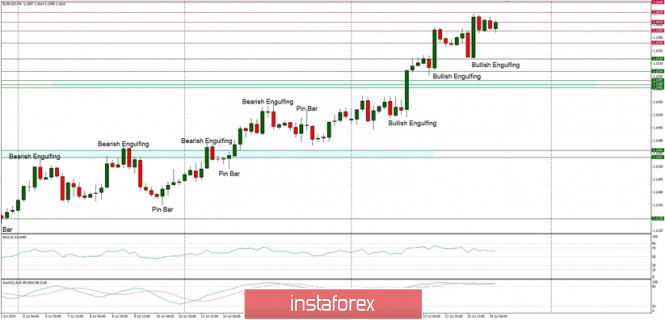
    Technical Analysis of EUR/USD for July 24, 2020:


    Technical Market Outlook:
    After the EUR/USD pair had broken through the long-term technical resistance located at the level of 1.1540, the up trend has been confirmed and it is being continued. Currently, the market is trying to extend the rally towards the level of 1.1629 or higher towards the level of 1.1648. The momentum is still strong and positive, but the market conditions are now overbought, so please keep in mind the pull-back scenario during the trading activities. If the support zone seen at the levels of 1.1497 - 1.1483 is clearly violated, then the bigger correction can take place with a target at the level of 1.1361 - 1.1347.The most important for bulls will be the weekly (2 days left) and monthly close (6 days left).

    Weekly Pivot Points:
    WR3 - 1.1642
    WR2 - 1.1541 WR1 - 1.1496
    Weekly Pivot - 1.1397
    WS1 - 1.1342
    WS2 - 1.1243
    WS3 - 1.1193

    Trading Recommendations:
    The key long-term technical resistance is seen at the level of 1.1540 has been violated, so the EUR/USD pair confirmed the up trend. The next targets in the long-term are seen at the levels of 1.1813 - 1.1851. There is no indication of any bigger correction to come, so all the dips should be bought until the level of 1.1347 is clearly violated.

    Analysis are provided byInstaForex.
    Best regards, PR Manager
    Learn more about InstaForex Company at http://instaforex.com

  6. #716
    Senior Member InstaForex Gertrude's Avatar
    Join Date
    Sep 2015
    Posts
    1,885
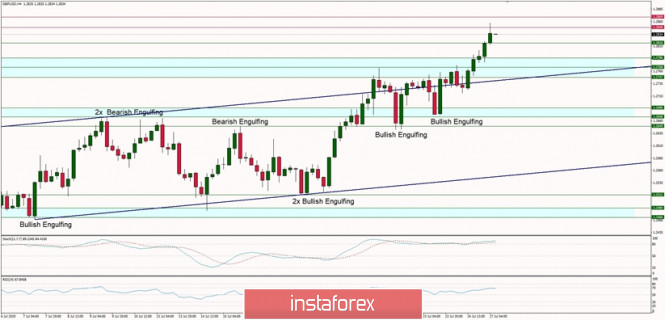
    Technical Analysis of GBP/USD for July 27, 2020:


    Technical Market Outlook:
    The GBP/USD pair has been moving up since the market opened after the weekend, so the new temporary swing high was made at the level of 1.2857. Moreover, the bulls had broken out from the ascending channel, which is rather another confirmation of the positive sentiment despite the overbought market conditions. The next target for bulls is seen at the level of 1.2869 and 1.2900. The nearest support is seen at the level of 1.2816 and 1.2786.

    Weekly Pivot Points:
    WR3 - 1.3215
    WR2 - 1.2993
    WR1 - 1.2929
    Weekly Pivot - 1.2717
    WS1 - 1.2632
    WS2 - 1.2427
    WS3 - 1.2355

    Trading Recommendations:
    On the GBP/USD pair the main trend is down, which can be confirmed by the down candles on the weekly time frame chart. The key long-term technical support is seen at the level of 1.1404. The key long-term technical resistance is seen at the level of 1.3518. Only if one of these levels is clearly violated, the main trend might reverse (1.3518) or accelerate (1.1404).

    Analysis are provided byInstaForex.
    Best regards, PR Manager
    Learn more about InstaForex Company at http://instaforex.com

  7. #717
    Senior Member InstaForex Gertrude's Avatar
    Join Date
    Sep 2015
    Posts
    1,885
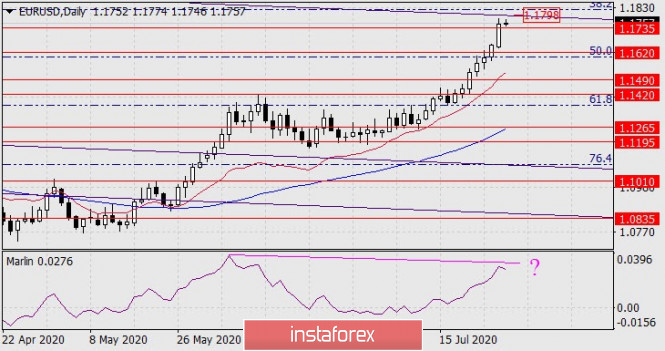
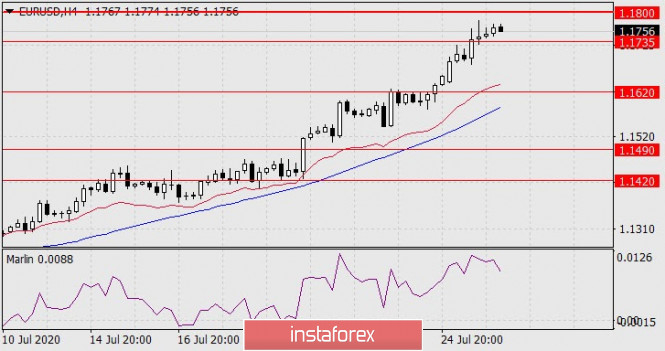
    Forecast for EUR/USD on July 28, 2020

    EUR/USD
    The euro decided to play its role to the end. Yesterday the price exceeded the target level of 1.1735, closing the day by gaining 96 points. Now the price should reach the upper border of the price channel around 1.1800. With the price level and the Marlin oscillator developing, divergence persists, respectively, we are waiting for the price to reverse down in the medium term. The timing may coincide that a reversal from such a key level will occur tomorrow, that is, on the day of the Federal Reserve's announcement of its decision on monetary policy.


    The oscillator shows a timid attempt to reverse against the rising price on the four-hour chart. This could be noise, or it could be warning a reversal. But since the Fed announces its decision tomorrow, the situation will be resolved on Wednesday.


    The main issue that concerns investors is the Fed's intention to target the yield curve for government bonds. If they hint that this is not necessary, the dollar will get a fresh dose of optimistic mood.


    Analysis are provided byInstaForex.
    Best regards, PR Manager
    Learn more about InstaForex Company at http://instaforex.com

  8. #718
    Senior Member InstaForex Gertrude's Avatar
    Join Date
    Sep 2015
    Posts
    1,885
    Control zones for USDCAD on 07/29/20

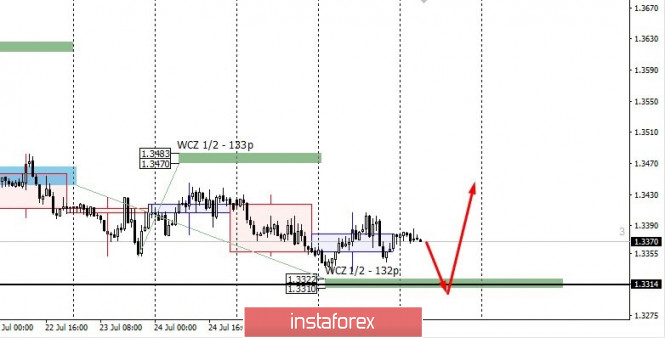
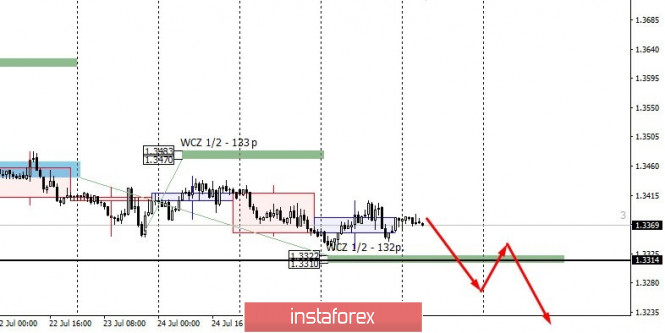
    The fall of the pair is a priority, so keeping sales will be beneficial. The 1.3314 level is within the average daily move, which is the June low. A test of this level will increase the likelihood of a large demand.


    It is important to note that the June low coincides with WCZ 1/2 1.3322-1.3310. This indicates the importance of the range for making trading decisions.

    An alternative pattern of continuing the fall will develop if the close of today's trading occurs below 1.3314. This will increase the likelihood of the Canadian dollar strengthening even further


    Daily CZ - daily control zone. The area formed by important data from the futures market, which changes several times a year.

    Weekly CZ - weekly control zone. The zone formed by important marks of the futures market, which changes several times a year.

    Monthly CZ - monthly control zone. The zone, which is a reflection of the average volatility over the past year.

    Analysis are provided byInstaForex.
    Best regards, PR Manager
    Learn more about InstaForex Company at http://instaforex.com

  9. #719
    Senior Member InstaForex Gertrude's Avatar
    Join Date
    Sep 2015
    Posts
    1,885
    Forecast for EUR/USD on July 30, 2020

    EUR/USD
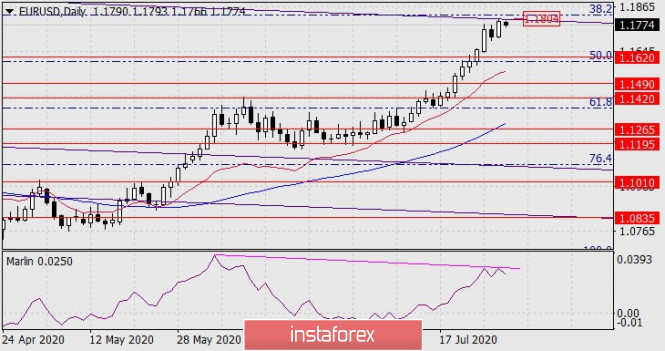
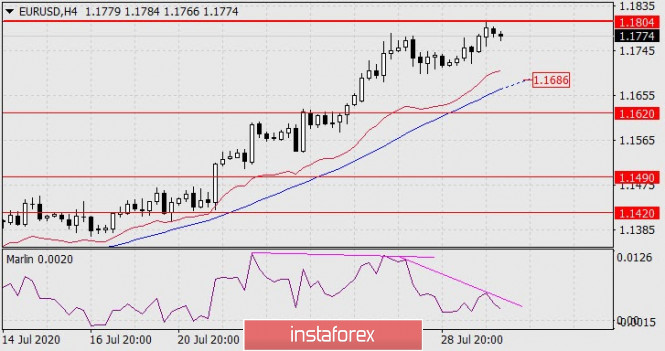
    Yesterday, the euro fulfilled its irresistible and inextinguishable desire to work out the border of the global price channel at around 1.1804. This channel originates from the July 2008 high. The price begins to form a divergence with the Marlin Oscillator. The first target of the decline is 1.1620.


    The Marlin divergence looks unambiguous on the four-hour chart, and it was created twice in a row. We are waiting for the price to move to the target level of 1.1620. On the way to it, the price will face an obstacle in the form of the MACD line in the area of 1.1686.


    Analysis are provided byInstaForex.
    Best regards, PR Manager
    Learn more about InstaForex Company at http://instaforex.com

  10. #720
    Senior Member InstaForex Gertrude's Avatar
    Join Date
    Sep 2015
    Posts
    1,885
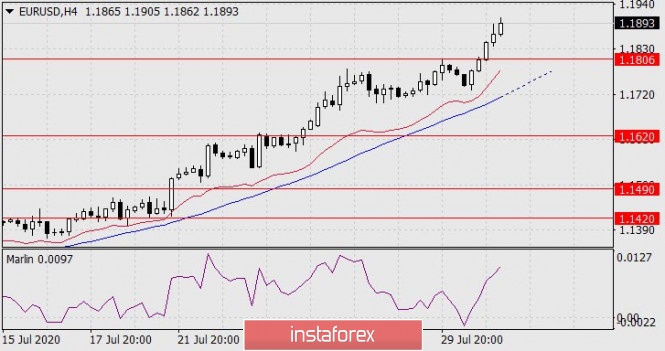
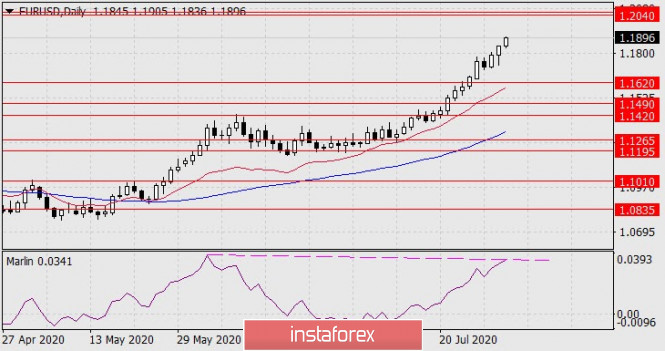
    Forecast for EUR/USD on July 31, 2020

    EUR/USD
    US President Donald Trump threw a bit of confusion into the markets by proposing to postpone the presidential vote from November 3 to a later date on the grounds that he believes too many voters have started voting by mail. Later, Trump abandoned the idea of postponing the elections, but the markets worked out the "joke": S&P 500 -0.38%, euro +56 points.


    Yesterday's growth has seriously changed the technical picture of the euro. First of all, the price went beyond the upper border of the global price channel, built on the highs of July 2008 and May 2014. Now this channel does not exist; instead, after creating a new peak, a new one will form.

    Yesterday's trading volume was not lower than the volumes of the last four days. This confirms the strength of the given momentum, now the growth target is the 1.2040/55 range. The reference point for the goal is the low of July 2017. The chances of forming a divergence between the price and the Marlin oscillator are already small, although this option is possible. This creates its own risks for opening new longs for the pair.


    The situation is completely upward on the H4 chart: the Marlin oscillator is moving up, the price is above the indicator lines. Growth in the target range of 1.2040/55 is possible even after a pullback. Safe for growth, the price may pull back to the 1.1806 level - to the July 29 high. Consolidating below the level, but even more reliable, consolidating under the MACD line, will mean the end of local growth.

    Analysis are provided byInstaForex.
    Best regards, PR Manager
    Learn more about InstaForex Company at http://instaforex.com

Page 72 of 180 FirstFirst ... 22 62 70 71 72 73 74 82 122 172 ... LastLast

Tags for this Thread

Bookmarks

Posting Permissions

  • You may not post new threads
  • You may not post replies
  • You may not post attachments
  • You may not edit your posts
  •