Page 78 of 178 FirstFirst ... 28 68 76 77 78 79 80 88 128 ... LastLast
Results 771 to 780 of 1774

Wave Analysis by InstaForex

This is a discussion on Wave Analysis by InstaForex within the Analytics and News forums, part of the Trading Forum category; Forecast for EUR/USD on October 12, 2020 EUR/USD The euro pulled away from the 1.1754 level last Friday and went ...


  1. #771
    Senior Member InstaForex Gertrude's Avatar
    Join Date
    Sep 2015
    Posts
    1,885
    Forecast for EUR/USD on October 12, 2020

    EUR/USD
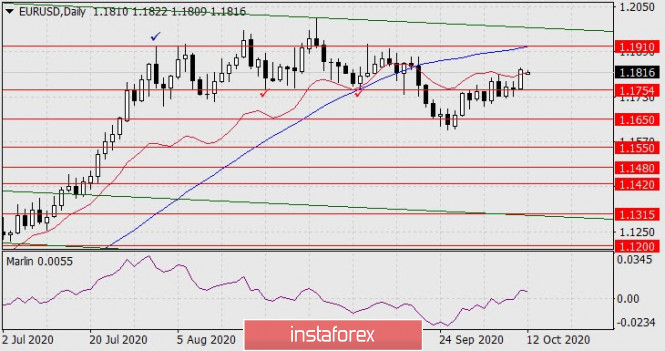
    The euro pulled away from the 1.1754 level last Friday and went beyond the resistance of the balance indicator line on the daily chart. The Marlin oscillator has entered the positive zone, indicating the prospect of price growth. The growth target is the MACD line at the 1.1910 level, which coincides with the high on July 31 (blue mark).


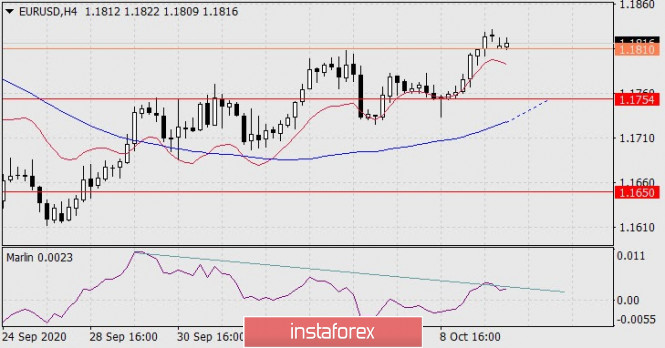
    The price settled above the signal level of 1.1810 on the four-hour chart, and even today's gap could not outwit this support. Marlin rises in the bullish zone. But the price forms a double or even, albeit not quite clear, triple divergence with the oscillator. And here, after slightly struggling above the signal level, a downward reversal is possible.


    Forming the final downward trend in the medium-term trend will progress if the price settles below the target level of 1.1754. It is possible that by the time the price attacks this level, the MACD line will also approach it.

    The euro's growth looks strong on the daily chart, we will determine the probability of rising to 1.1910 at 60%, but the market can easily take advantage of the remaining 40% of the reversal scenario. The first condition for further growth is when the price settles above the Friday high. We are waiting for the development of events.

    Analysis are provided byInstaForex.
    Best regards, PR Manager
    Learn more about InstaForex Company at http://instaforex.com

  2. #772
    Senior Member InstaForex Gertrude's Avatar
    Join Date
    Sep 2015
    Posts
    1,885
    AUD/USD forecast for October 13, 2020

    AUD/USD
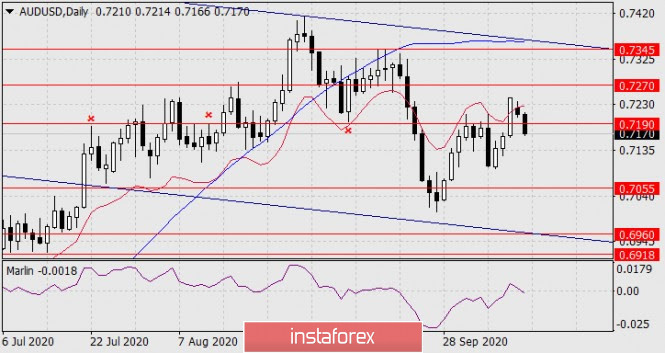
    The Australian dollar did not close the gap at the opening of the week, so the current decline of 65 points from Friday's close may only be a correction from the growth of the previous days. According to Monday's review, the possible growth will also have the character of a correction from the movement starting September 1 and may end before reaching any of the target levels even at the nearest 0.7270.


    The Marlin oscillator went into a downward trend zone. Formally, this means that the price is moving towards the first target level of 0.7055, but let's look at the situation on a smaller chart.


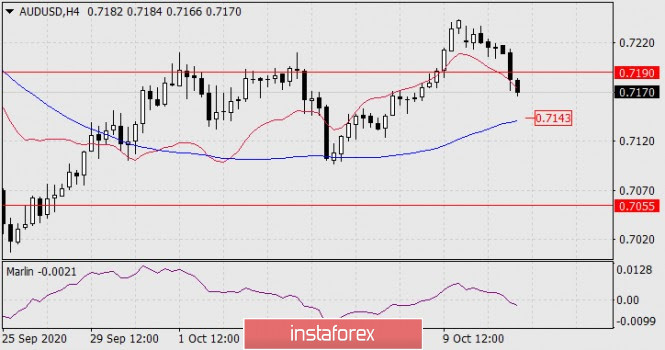
    On the H4 chart, there is currently no price fixing under the level of 0.7190. The next candle should open under this level to achieve this. Also, the price remains above the Kruzenshtern indicator line at 0.7143 and even above the balance indicator line, i.e. the observed decline occurs within the growing short-term trend. Only the Marlin oscillator reminds the price that it is time to finish with growth but is still weak.

    So, for the development of a downward scenario in the short term up to two weeks, the price should be fixed under the Kruzenshtern line below 0.7143. In the case of a medium-term decline in the AUD/USD currency pair, the impact of the gap (especially insignificant) can be ignored, sometimes they are closed only after a few years.

    Analysis are provided byInstaForex.
    Best regards, PR Manager
    Learn more about InstaForex Company at http://instaforex.com

  3. #773
    Senior Member InstaForex Gertrude's Avatar
    Join Date
    Sep 2015
    Posts
    1,885
    Forecast for EUR/USD on October 14, 2020

    EUR/USD
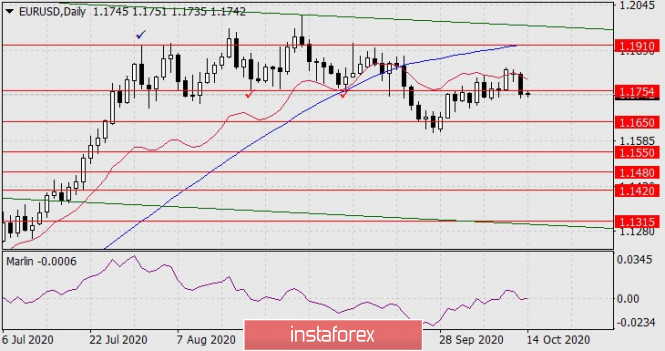
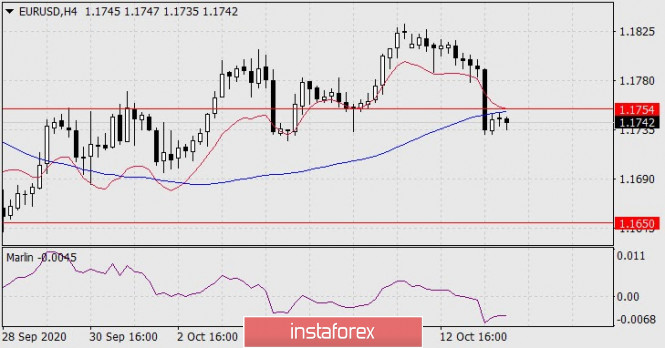
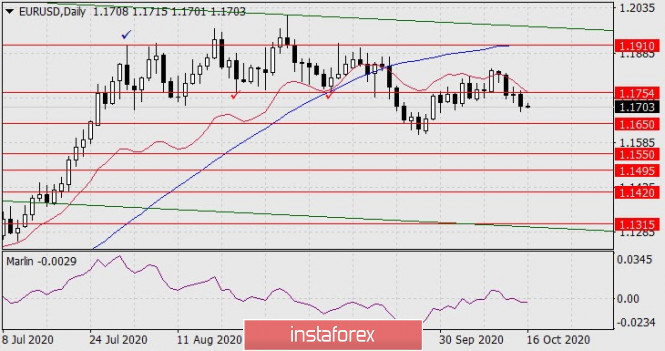
    The S&P 500 lost 0.63% on Tuesday, on the news that Johnson & Johnson's anti-skin vaccine trial was suspended due to severe side effects, and so the euro fell by 66 points. This, as we see it, stopped the speculative growth over the euro that has been ongoing for the past two weeks. The price moved below the target level of 1.1754, having reversed from the resistance of the balance line on the daily chart. The Marlin oscillator is back in the negative territory. Now we are waiting for the price to drop to the target level of 1.1650, then to 1.1550 (November 2017 low).


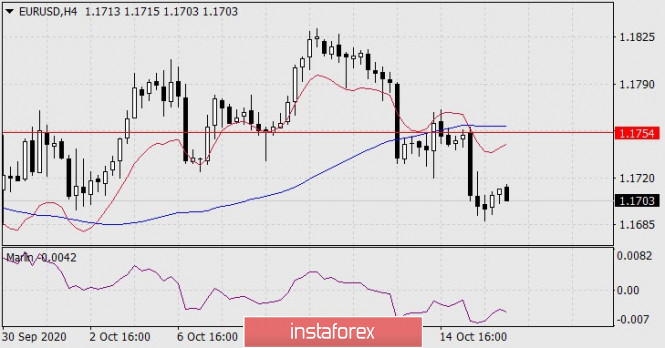
    The price settled under the MACD line on the four-hour chart, while Marlin is in the negative zone. Conditions for a further decline have been formed, we are waiting for the price at the indicated levels.


    Analysis are provided byInstaForex.
    Best regards, PR Manager
    Learn more about InstaForex Company at http://instaforex.com

  4. #774
    Senior Member InstaForex Gertrude's Avatar
    Join Date
    Sep 2015
    Posts
    1,885
    Forecast for EUR/USD on October 15, 2020

    EUR/USD
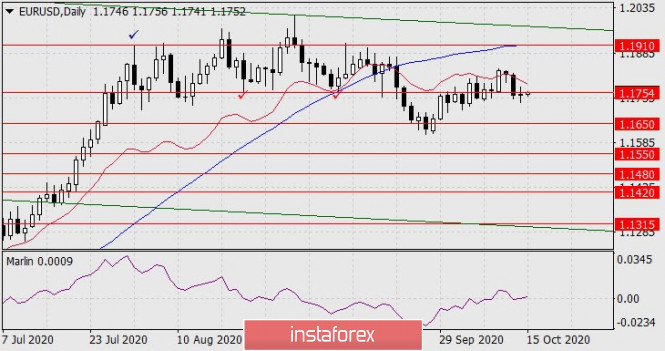
    The situation has not changed for the euro over the past day. Trading was weak on Wednesday, the price is also settling below the 1.1754 level. The Marlin oscillator moves along the border that separates the growth zone from the decline zone on the daily chart. Outwardly, the situation is neutral, but the price is developing below the red balance indicator line, which means consolidating in a dynamic downward trend. The 1.1650 target is dominant, the probability of reaching it is 65-70%.


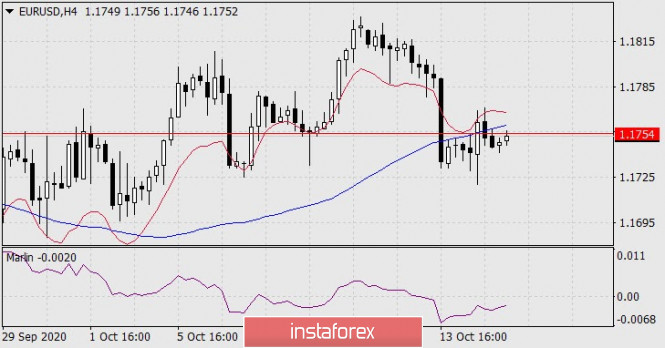
    The four-hour chart shows that yesterday's attempt to go beyond the area above the MACD line turned out to be weak, the price has already settled below it and is ready to continue its decline. The Marlin oscillator is growing in the downward trend zone, but this growth in structure is the indicator unloading before declining even deeper.


    Analysis are provided byInstaForex.
    Best regards, PR Manager
    Learn more about InstaForex Company at http://instaforex.com

  5. #775
    Senior Member InstaForex Gertrude's Avatar
    Join Date
    Sep 2015
    Posts
    1,885
    Forecast for EUR/USD on October 16, 2020

    EUR/USD
    The euro opened and ended Thursday at 1.1754, the area which is below the key level of the lower boundary of the monthly range of the second half of August and the first half of September. This means that the initial condition for the medium-term downward trend has been met. We are waiting for the price to fall to 1.1315. But the euro's first target is the 1.1650 level, followed by the second target at 1.1550 - the November 2017 low. The Marlin oscillator has strengthened in the territory of the downward trend zone.


    According to the indicators, the trend is downward on the four-hour chart, but the signal line of the Marlin oscillator sharply turned upwards, which may indicate a deepening correction. The limit for the corrective growth is the 1.1754 level . The price will give a new downward momentum if the price moves below yesterday's low of 1.1688.


    Analysis are provided byInstaForex.
    Best regards, PR Manager
    Learn more about InstaForex Company at http://instaforex.com

  6. #776
    Senior Member InstaForex Gertrude's Avatar
    Join Date
    Sep 2015
    Posts
    1,885
    Technical Analysis of EUR/USD for October 19, 2020


    Technical Market Outlook:

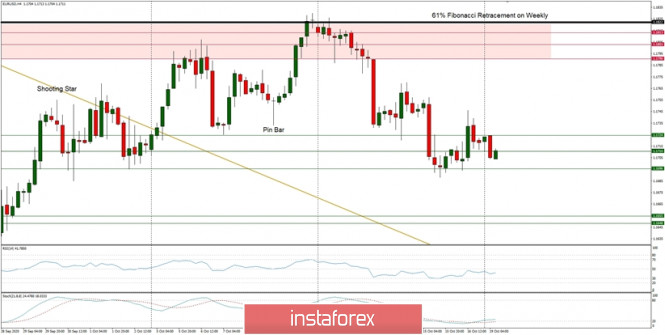
    The EUR/USD pair has been seen moving lower at the beginning of the trading week. The last lower low was made at the level of 1.1688, just below the technical support seen at the level of 1.1696 and this is the next target for the bears. The nearest technical resistance is seen at the level of 1.1746. Despite the oversold conditions, the momentum remains weak and negative, which support the short-term bearish outlook.

    Weekly Pivot Points:
    WR3 - 1.1924
    WR2 - 1.1873
    WR1 - 1.1783
    Weekly Pivot - 1.1733
    WS1 - 1.1641
    WS2 - 1.1593
    WS3 - 1.1509

    Trading Recommendations:
    Since the middle of March 2020 the main trend is on EUR/USD pair has been up, which can be confirmed by almost 10 weekly up candles on the weekly time frame chart and 4 monthly up candles on the monthly time frame chart. Nevertheless, weekly chart is recently showing some weakness in form of a several Pin Bar candlestick patterns at the recent top seen at the level of 1.2004. This means any corrections should be used to buy the dips until the key technical support is broken. The key long-term technical support is seen at the level of 1.1445. The key long-term technical resistance is seen at the level of 1.2555.

    Analysis are provided byInstaForex.
    Best regards, PR Manager
    Learn more about InstaForex Company at http://instaforex.com

  7. #777
    Senior Member InstaForex Gertrude's Avatar
    Join Date
    Sep 2015
    Posts
    1,885
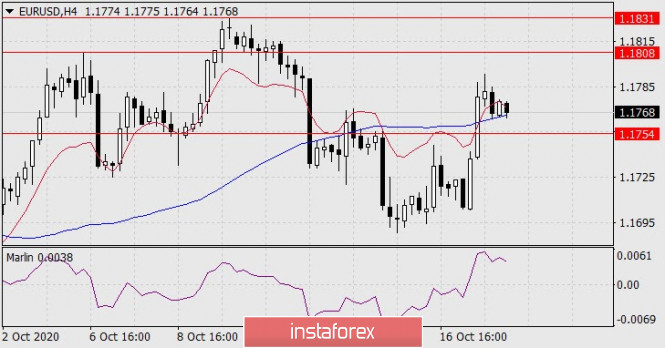
    Forecast for EUR/USD on October 20, 2020

    EUR/USD
    The euro has grown by 50 points on Monday. News agencies attribute the growth to hopes for a stimulus package in the United States before the presidential election and the imminent appearance of a coronavirus vaccine. As a rule, there are two cases why the media releases information: to cover up speculative operations, and when no one knows the reason. At the moment, we do not see any sense in speculative operations, respectively, this is how large players operate. Appetite for risk in the market has not increased, as US stock indexes lost around one and a half percent yesterday.


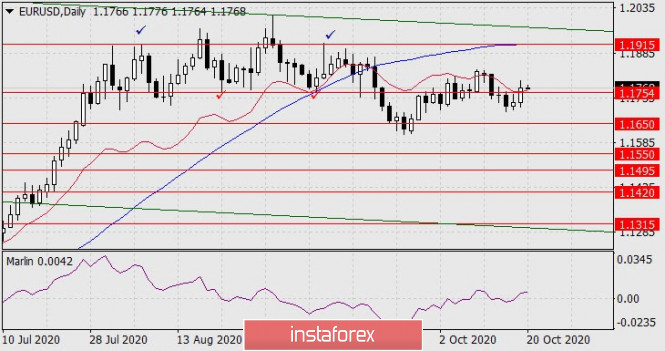
    Nevertheless, the momentum is set, the price could slightly rise a little more before it decisively falls. The growth target could be the October 6 high at 1.1808. The price crossed the balance indicator line on the daily chart, while Marlin entered the growth zone. A delay above the levels will strengthen the bulls' position and the pair could grow to 1.1915 in the near future - to the MACD line on the daily timeframe. If the pair closes below 1.1754, which will also correspond to the close below the balance line, then a deeper movement down to the target levels 1.1650 and 1.1550 will begin tomorrow.


    The price settled above both indicator lines on the four-hour chart, Marlin is in the positive zone, indicating a short-term downward reversal. Here the situation repeats the daily scenarios - the price settling below 1.1754, respectively, and below the MACD line, will become a platform for reaching 1.1650. Settling in the area above 1.1808 will not yet be a condition for rising to 1.1915 just yet, as there are other resistances along this speculative and volatile path. For example, 1.1831 is the peak on October 9.

    Analysis are provided byInstaForex.
    Best regards, PR Manager
    Learn more about InstaForex Company at http://instaforex.com

  8. #778
    Senior Member InstaForex Gertrude's Avatar
    Join Date
    Sep 2015
    Posts
    1,885
    Technical Analysis of ETH/USD for October 21, 2020


    Crypto Industry News:
    Speculation about Ethereum 2.0 continues, and there are newer and newer leaks from insiders. One recent speculation is where the developer of Ethereum 2.0 predicts that a smart protocol contract allowing their Ethers to be deposited on 2.0 networks will be released in a matter of days. The staking process itself would start later this year.

    ConsenSys developer Ben Edgington posted an entry that predicts the genesis of the ETH 2.0 beacon chain will take place in the next six to eight weeks.
    In a post announcing the launch of the zero version for client 1.0, Edgington revealed that the protocol's smart contract feature should be announced this week. A smart escrow contract that allows ETH sending between Network 1.0 and Network 2.0 and is one of the few remaining updates needed to facilitate Ethereum 2.0 rollout in Phase 0. To complete Phase 0 launch, 500,000 Ethers will need to be staked once the beacon chain has started. After that, the network will prepare for the official launch for several weeks.

    Technical Market Outlook:
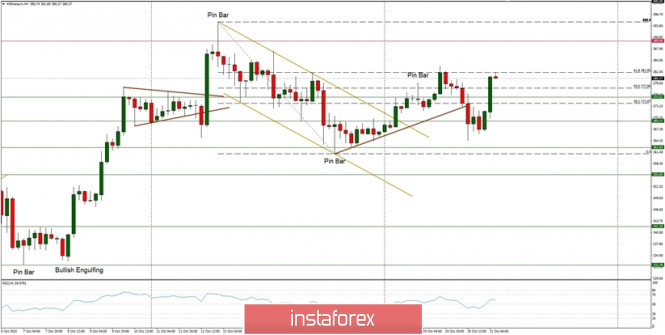
    The ETH/USD pair has extended the retracement towards the level of 61% located at $381.85, then the market pulled back towards the intraday support at $375.52 and bounced to the $381.85 again. The target for bulls is still seen at the level of $400 and the bulls are consolidating the recent gains. The nearest technical resistance is seen at the level of $389.90 and at the swing top at $394.95. On the other hand, the target for bears is seen at the level of $360.60 and $355.60 and the nearest technical support is seen at the level of $369.37.

    Weekly Pivot Points:
    WR3 - $424.52
    WR2 - $408.88
    WR1 - $391.97
    Weekly Pivot - $376.47
    WS1 - $357.63
    WS2 - $341.22
    WS3 - $328.22

    Trading Recommendations:
    The weekly and monthly time frame trend on the ETH/USD pair remains up and there are no signs of trend reversal, so buy orders are preferred in the mid-term. Moreover, bulls had bounced from the weekly trend line support last week and now are away from it. The key mid-term technical support is currently seen at the level of $305.20 - $321.95, so all the dynamic corrections are still being used to buy the dips. The next mid-term target for bulls is seen at the level of $500.

    Analysis are provided byInstaForex.
    Best regards, PR Manager
    Learn more about InstaForex Company at http://instaforex.com

  9. #779
    Senior Member InstaForex Gertrude's Avatar
    Join Date
    Sep 2015
    Posts
    1,885
    Forecast for EUR/USD on October 22, 2020

    EUR/USD
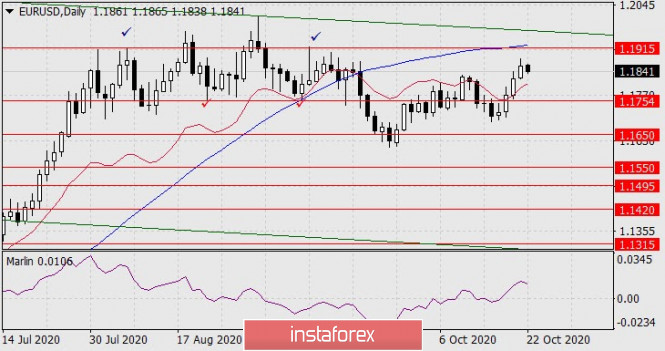
    Yesterday, the effect of good expectations worked on the markets - according to Michel Barnier, investors sensed the possibility of an EU-UK deal and began to buy both the euro and the pound. As a result, the euro grew by 39 points, the pound by 198 points. The euro did not reach the target level of 1.1915 by around 35 points, which raises a difficult question, will it work out at all or not? The signal line of the Marlin oscillator has already begun to reverse.


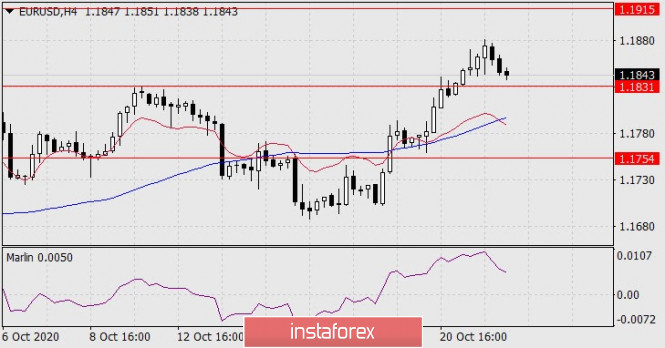
    The Marlin is also turning around on the 4-hour timeline, but there are no actual reversal signals yet. It is very likely that the price will still reach the designated target, slightly going beyond it in order to reach the MACD line on the daily scale, and this will form a divergence reversal with Marlin.


    So, we are waiting for the price to grow to the previously indicated level in the area of the MACD line on the daily chart at 1.191520.

    Analysis are provided byInstaForex.
    Best regards, PR Manager
    Learn more about InstaForex Company at http://instaforex.com

  10. #780
    Senior Member InstaForex Gertrude's Avatar
    Join Date
    Sep 2015
    Posts
    1,885
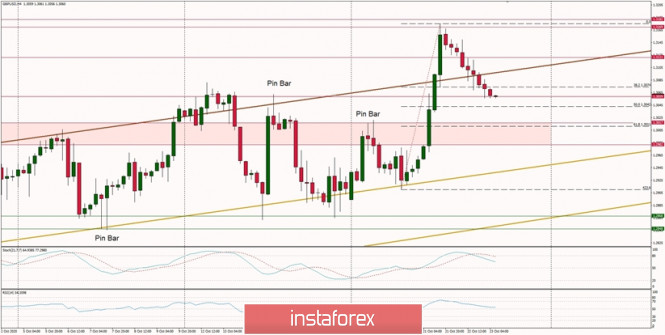
    Technical Analysis of GBP/USD for October 23, 2020


    Technical Market Outlook:
    The GBP/USD pair keeps going lower as the corrective cycle from the local high at 1.3180 continues. The price has broken below the 38% Fibonacci retracement seen at 1.3074 and is heading towards the level of 50% located at 1.3041. The market is coming off the overbought levels, so the price might get below 1.3000 zome again. The key technical support is still seen at the level of 1.2982 - 1.3017. Moreover, it is worth to keep an eye on the upper channel line again for any indication of broken support.

    Weekly Pivot Points:
    WR3 - 1.3222
    WR2 - 1.3147
    WR1 - 1.3005
    Weekly Pivot - 1.2924
    WS1 - 1.2790
    WS2 - 1.2718
    WS3 - 1.2567

    Trading Recommendations:
    On the GBP/USD pair the main, multi-year trend is down, which can be confirmed by the down candles on the monthly time frame chart. The key long-term technical resistance is still seen at the level of 1.3518. Only if one of these levels is clearly violated, the main trend might reverse (1.3518 is the reversal level) or accelerate towards the key long-term technical support is seen at the level of 1.1903 (1.2589 is the key technical support for this scenario).

    Analysis are provided byInstaForex.
    Best regards, PR Manager
    Learn more about InstaForex Company at http://instaforex.com

Page 78 of 178 FirstFirst ... 28 68 76 77 78 79 80 88 128 ... LastLast

Tags for this Thread

Bookmarks

Posting Permissions

  • You may not post new threads
  • You may not post replies
  • You may not post attachments
  • You may not edit your posts
  •