
 6Likes
 LinkBack URL
 About LinkBacks


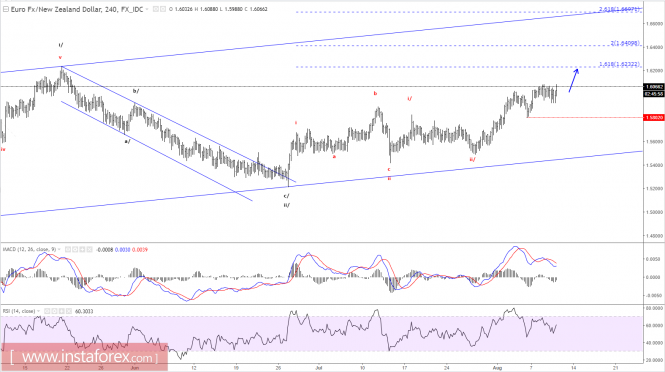
Elliott wave analysis of EUR/NZD for August 10, 2017
Wave summary:
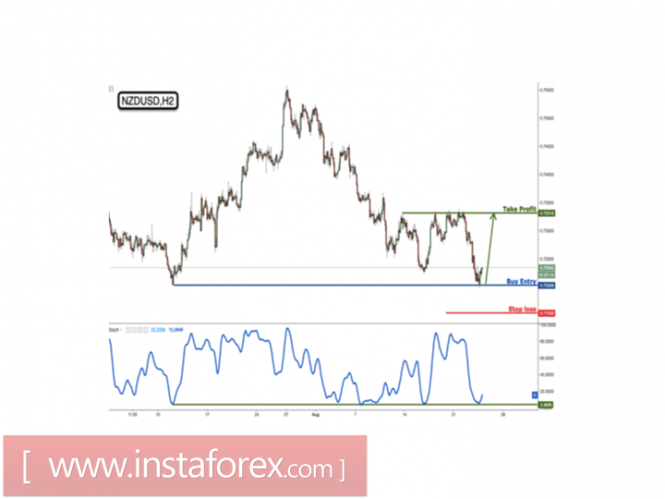
EUR/NZD continues to work its way higher towards the expected target at 1.6236. This resistance should only be able to provide temporary resistance, before the next swing higher towards 1.6969.
Short-term support is now seen at 1.6005 and again at 1.5920.
R3: 1.6236
R2: 1.6196
R1: 1.6081
Pivot: 1.6050
S1: 1.6005
S2: 1.5959
S3: 1.5920
Trading recommendation:
We are long EUR from 1.5510 with stop placed at 1.5825. If you are not long EUR yet, then buy near 1.6005 and use the same stop at 1.5825.
Analysis are provided byInstaForex.


 Reply With Quote


Bookmarks