
 2Likes
 LinkBack URL
 About LinkBacks


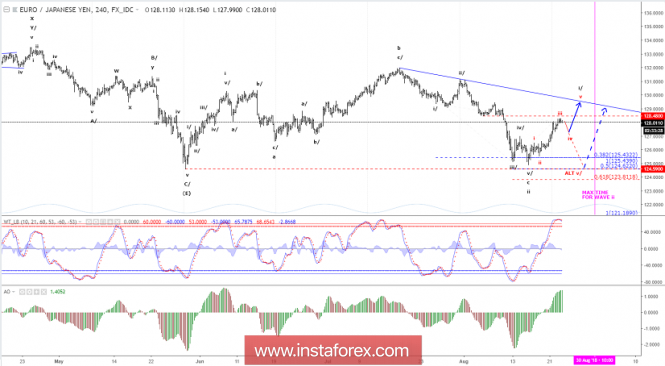
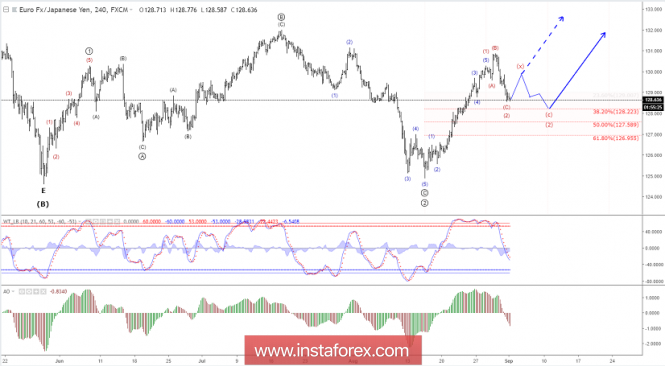
Elliott wave analysis of EUR/JPY for August 23, 2018
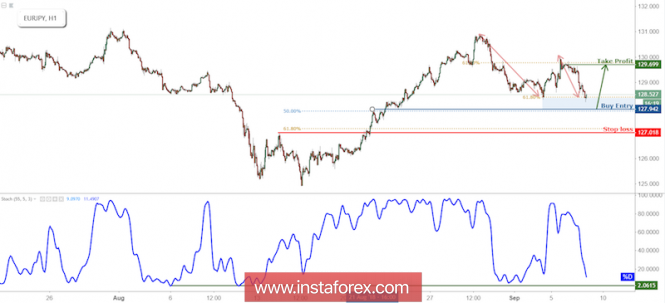
EUR/JPY still has not broken important short-term resistance at 128.48, but then it has not started to move strongly lower as we normally should expect at the completion of an expanded flat.
Therefore we are shifting our preferred count in favor of wave C and II having completed with the test of 124.86 and wave III now in its infancy. Under this count EUR/JPY should make a small downward correction towards 127.23 - 127.33 area in red wave iv and then move higher towards the 128.92 - 129.32 area in red wave v.
This will complete black wave i/ and should set the stage for a corrective decline in wave ii/ towards the 125.76 - 126.44 area before the next impulsive rally higher. That said, the possibility of a final dip closer to 124.62 remains possible, but time is running out fast.
R3: 128.92
R2: 128.48
R1: 128.24
Pivot: 127.93
S1: 127.72
S2: 127.50
S3: 127.33
Trading recommendation:
We are 50% long EUR from 126.26 with our stop placed at 126.84. We will take profit on the final 50% at 128.75. *The market analysis posted here is meant to increase your awareness, but not to give instructions to make a trade.
Analysis are provided byInstaForex.


 Reply With Quote


Bookmarks