Page 26 of 180 FirstFirst ... 16 24 25 26 27 28 36 76 126 ... LastLast
Results 251 to 260 of 1795

Wave Analysis by InstaForex

This is a discussion on Wave Analysis by InstaForex within the Analytics and News forums, part of the Trading Forum category; Trump's trade policy continues to work The euro continued to decline against the US dollar in the morning of Monday, ...


  1. #251
    Senior Member InstaForex Gertrude's Avatar
    Join Date
    Sep 2015
    Posts
    1,885
    Trump's trade policy continues to work

    The euro continued to decline against the US dollar in the morning of Monday, August 6, amid the lack of important fundamental statistics, as well as expectations of further interest rate hikes in the United States.

    Data on the sharp decline in orders in Germany put pressure on risky assets.

    According to a report by the German Ministry of Economy, production orders in Germany declined sharply in June this year due to falling demand from countries outside the eurozone. This suggests that the current tensions in trade relations are already affecting the indicators, which will further exacerbate tensions between the US and the EU.

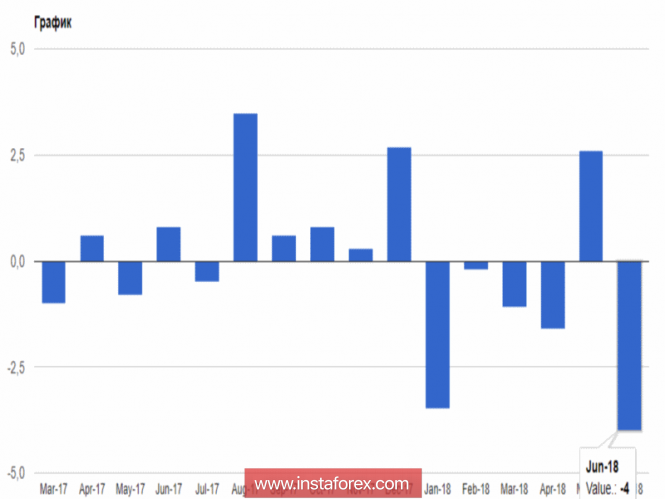
    As indicated in the report, orders in the manufacturing sector in Germany in June 2018 fell by 4.0% compared to May, while economists had forecast a decline in orders by 0.5%. The ministry confirmed the fact that the uncertainty of the prospects of trade policy played a key role.

    External orders in the German manufacturing sector in June fell by 4.7% compared to May, while domestic production orders decreased 2.8% compared to the previous month.


    As I noted above, a particular decrease in orders was observed from countries that are not members of the eurozone. Here the figure fell by 5.9%. Compared to the same period of the previous year, orders in the German manufacturing sector decreased by 0.8%.

    As for the technical picture of the EUR/USD pair, then, most likely, the pressure on the euro will continue. The breakthrough of support of 1.1530 will lead to new large sales in risky assets, with an exit to the lows of the month in the area of 1.1480 and 1.1440. The only hope of buyers in the short term is a return to the resistance of 1.1565, which will lead to an upward correction in the area of 1.16 and 1.1630.

    The British pound continued to decline, ignoring the report on the volume of consumer lending in the UK, which in June this year has not changed compared to may. This shows that consumer spending will continue to grow in the future.

    According to the Bank of England, in June 2018, net consumer lending to consumers in June amounted to 5.4 billion pounds against 5.3 billion pounds in May. Credit cards in June amounted to 1.6 billion pounds.

    As for mortgage loans, the number was at the level of 65,619. As for the technical picture of the GBP/USD pair, the recovery prospects are also quite far. Brexit and uncertainty with a further increase in interest rates in the UK continue to weigh on the pound.

    The current main goal of the sellers of the pound is the lows of 1.2890 and 1.2815. If we talk about the prospects for an upward correction, then, apparently, it will be limited in the area of resistances 1.2960 and 1.3000.

    Analysis are provided byInstaForex.
    Best regards, PR Manager
    Learn more about InstaForex Company at http://instaforex.com

  2. #252
    Senior Member InstaForex Gertrude's Avatar
    Join Date
    Sep 2015
    Posts
    1,885
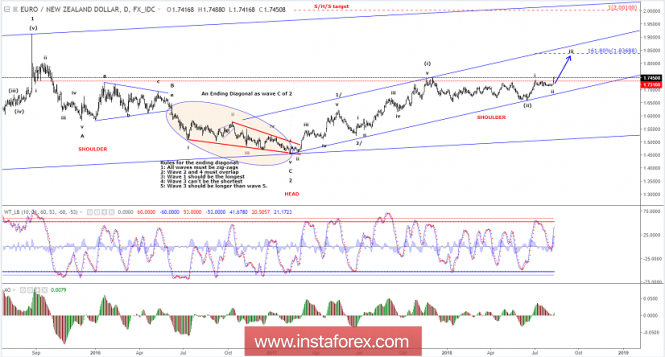
    Elliott wave analysis of EUR/NZD for August 8, 2018


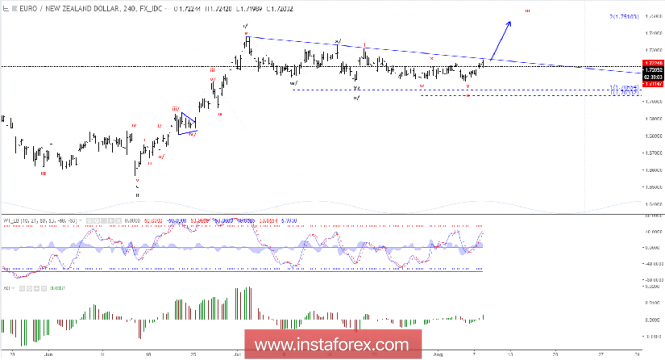
    EUR/NZD is once again testing important resistance at 1.7224, but we need a clear break above here to confirm that the next impulsive rally towards 1.7510 is in motion. As long as resistance at 1.7224 is able to cap the upside as long does the possibility for a final drop into the 1.7033 - 1.7066 area exist, before completing wave ii/.

    Longer-term, we remain bullish EUR/NZD for a rally towards 1.8310 and ultimately higher towards 1.98 - 1.99 area.

    R3: 1.7305
    R2: 1.7251
    R1: 1.7224
    Pivot: 1.7187
    S1: 1.7150
    S2: 1.7115
    S2: 1.7094

    Trading recommendation:
    We are long EUR from 1.7226 with our stop placed at 1.7110.

    Analysis are provided byInstaForex.
    Best regards, PR Manager
    Learn more about InstaForex Company at http://instaforex.com

  3. #253
    Senior Member InstaForex Gertrude's Avatar
    Join Date
    Sep 2015
    Posts
    1,885
    Is the black band for gold over?

    The leader of the precious metals sector, who marked its worst start in the last decade, managed to take a breather due to the strengthening of the Chinese yuan and the Japanese yen against the US dollar. The strong US currency has become the main culprit of the XAU/USD pair slumping by 7% since the beginning of the year. According to the World Gold Council report, global demand fell to 1959 tons in January-June, which is the lowest value since 2009. During the same period in 2017 it was about 2086 tons. And while interest in jewelry and the use of metal in the industry has been stable, the outflow of capital from the ETF became the main driver of falling prices.

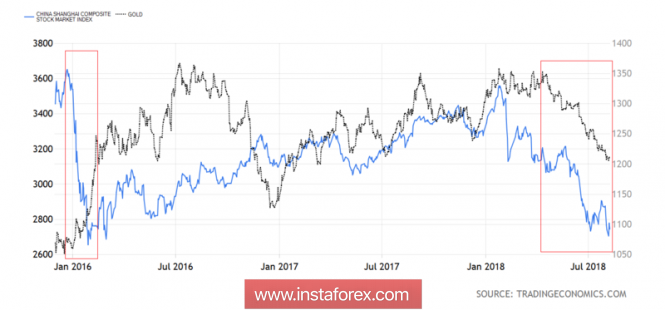
    According to WGC research, the reserves of specialized exchange-traded funds increased by a modest 60.9 tons in the first half of 2018. In January-June 2017, the process was significantly faster (+160.9 tons). The dog is buried in the flight of American investors from the market. Against the background of the dispersal of US GDP to 4.1% q/q, they preferred to buy securities rather than revenue-generating precious metals. The story of the collapse of Chinese stock indices under the influence of the slowdown of the Chinese economy and trade wars did not help either. If at the beginning of 2016 gold grew in response to the fall of Shanghai Composite, then this year assets prefer to go one way.

    Dynamics of gold and the Shanghai Composite


    If we focus on the dynamics of capital outflow from the ETF, we can assume that the XAU/USD will continue the downward campaign. Thus, according to Commerzbank's estimates, after the loss of stock of specialized exchange-traded funds of 29 tons in July, from the beginning of August they sank by another 16 tons. The bank expects that in the near future, under the influence of aggressive monetary tightening of the Fed, gold will test the psychologically important mark of $1200 per ounce. Supporters and speculators, who as of July 31 accumulated a record from 2006 net position on the analyzed asset in the futures market 27 156 contracts, equivalent to 2.7 million ounces.

    Standard Bank, on the contrary, believes that the black band for the precious metal has remained in the past. The factor of four increases in the federal funds rate in 2018 is practically taken into account in the quotes of the USD index (the futures market gives about 70% of the probability of such an outcome), investors are unlikely to be surprised by this. But the slower normalization of monetary policy of the Fed or the loss of US GDP by the pair can lead to an increase in XAU/USD quotes to $1,260 per ounce in the third quarter. Before the end of the year, gold can test the level of $1300.

    The pluralism of opinions allows the "bulls" of the precious metal to take a breath and contributes to its consolidation in the range of $1205-1235 per ounce. Investors will closely monitor the release of data on US inflation for July. Overclocking the CPU to 3% and above will increase the chances of four Fed rate increases and will contribute to the strengthening of the dollar.

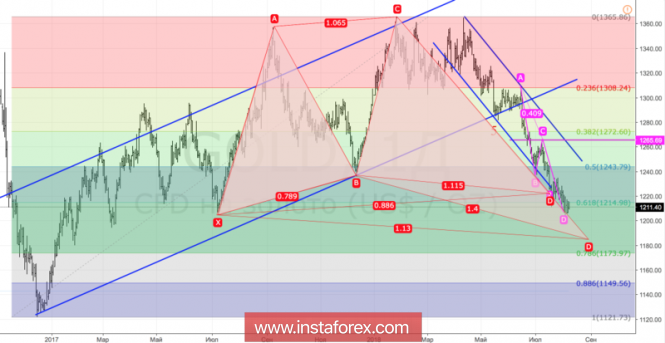
    Technically, gold reaching the convergence zone of $1185-1220 per ounce (targets for 88.6% and 113% on the "Double top" pattern) increases the risks of a rollback to the current short-term downward trend.

    Gold, daily chart


    Analysis are provided byInstaForex.
    Best regards, PR Manager
    Learn more about InstaForex Company at http://instaforex.com

  4. #254
    Senior Member InstaForex Gertrude's Avatar
    Join Date
    Sep 2015
    Posts
    1,885
    Elliott wave analysis of EUR/NZD for August 10, 2018


    After some sideways consolidation between 1.7352 - 1.7448 more upside will be expected towards the next minor upside targets at 1.7924 on the way higher towards 1.8369 and 1.8423.

    Support is now seen at 1.7404 and again at 1.7352. Ideally the later will be able to protect the downside for a clear break above 1.7480 confirming the next part of the uptrend towards 1.7924.

    Only a break below support at 1.7301 will question the expected rally higher.

    R3: 1.7667
    R2: 1.7564
    R1: 1.7480
    Pivot: 1.7437
    S1: 1.7404
    S2: 1.7388
    S3: 1.7352

    Trading recommendation:
    We are long EUR from 1.7226 and we will raise our stop to 1.7275.

    Analysis are provided byInstaForex.
    Best regards, PR Manager
    Learn more about InstaForex Company at http://instaforex.com

  5. #255
    Senior Member InstaForex Gertrude's Avatar
    Join Date
    Sep 2015
    Posts
    1,885
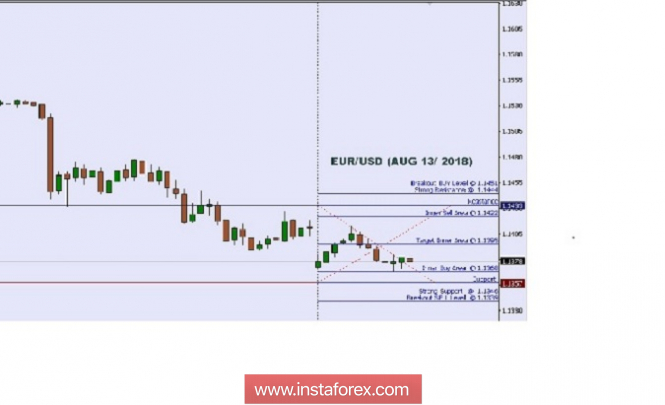
    Technical analysis: Intraday Level For EUR/USD, Aug 13, 2018


    When the European market opens, there will be no Economic Data released, but the US will release the Economic Data such as Mortgage Delinquencies, so, amid the reports, EUR/USD will move in a low to medium volatility during this day.

    TODAY'S TECHNICAL LEVEL:
    Breakout BUY Level: 1.1451.
    Strong Resistance:1.1444.
    Original Resistance: 1.1433.
    Inner Sell Area: 1.1422.
    Target Inner Area: 1.1395.
    Inner Buy Area: 1.1368.
    Original Support: 1.1357.
    Strong Support: 1.1346.
    Breakout SELL Level: 1.1339.

    Analysis are provided byInstaForex.
    Best regards, PR Manager
    Learn more about InstaForex Company at http://instaforex.com

  6. #256
    Senior Member InstaForex Gertrude's Avatar
    Join Date
    Sep 2015
    Posts
    1,885
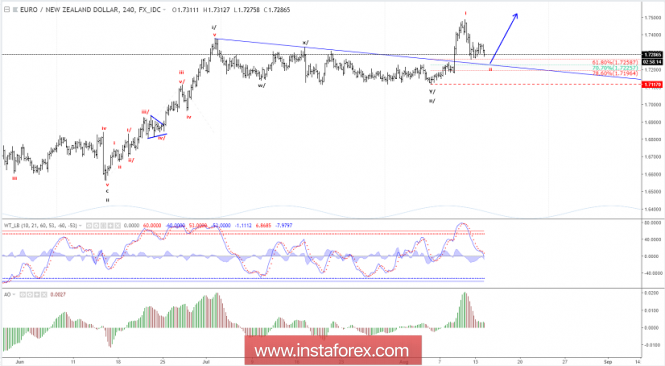
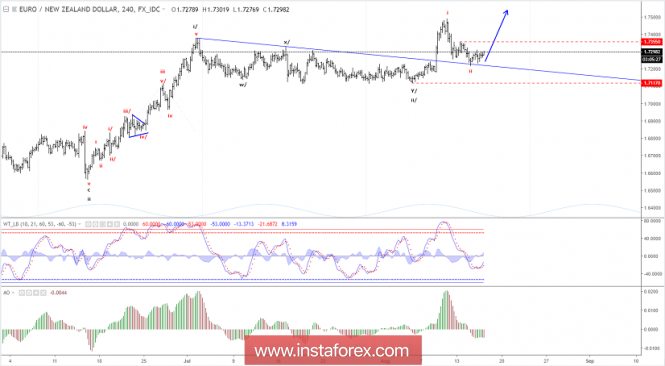
    Elliott wave analysis of EUR/NZD for August 14, 2018


    We are looking for red wave ii to complete in the 1.7196 - 1.7258 target-zone. Once this correction is complete a new impulsive rally to above 1.7487 is expected for a continuation higher to 1.7924 and 1.8369 as the next upside important upside targets. Short-term only a break above minor resistance at 1.7356 will indicate that a corrective low has been seen for red wave ii and red wave iii is taking over for a rally to above 1.7487.

    R3: 1.7487
    R2: 1.7417
    R1: 1.7355
    Pivot: 1.7322
    S1: 1.7258
    S2: 1.7226
    S3: 1.7196

    Trading recommendation:
    We will re-buy EUR at 1.7245 or upon a break above 1.7356.

    Analysis are provided byInstaForex.
    Best regards, PR Manager
    Learn more about InstaForex Company at http://instaforex.com

  7. #257
    Senior Member InstaForex Gertrude's Avatar
    Join Date
    Sep 2015
    Posts
    1,885
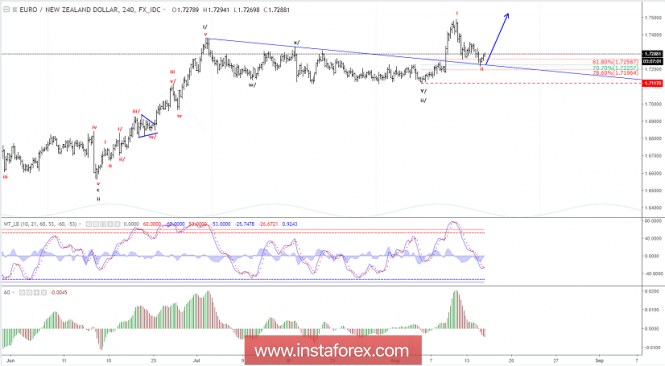
    Elliott wave analysis of EUR/NZD for August 15, 2018


    After a dip to 1.7220 all requirements for the correction in red wave i has been fulfilled. Therefore we are looking for a break above resistance at 1.7355 to confirm that red wave iii is developing for a break above the peak at 1.7484 as EUR/NZD moves higher towards 1.7924 and 1.8369.

    Short-term support is seen at 1.7243, this support should ideally be able to protect the downside, for the expected rally higher. If, however, a break below 1.7243 is seen, a final dip closer to 1.7196 should be expected to complete red wave ii.

    R3: 1.7487
    R2: 1.7417
    R1: 1.7355
    Pivot: 1.7299
    S1: 1.7270
    S2: 1.7243
    S3: 1.7220

    Trading recommendation:
    We are long EUR from 1.7245 with our stop placed at 1.7215.

    Analysis are provided byInstaForex.
    Best regards, PR Manager
    Learn more about InstaForex Company at http://instaforex.com

  8. #258
    Senior Member InstaForex Gertrude's Avatar
    Join Date
    Sep 2015
    Posts
    1,885
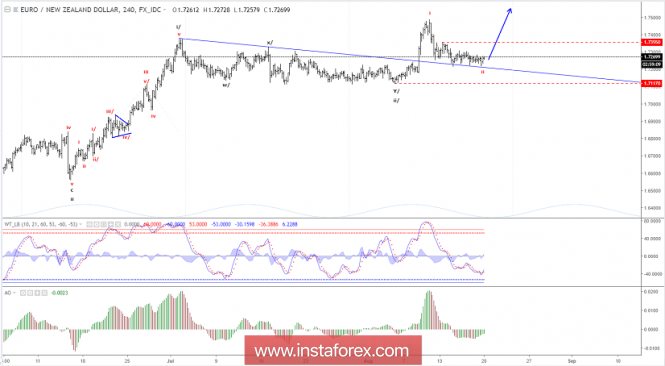
    Elliott wave analysis of EUR/NZD for August 16, 2018


    A break above resistance at 1.7355 is still needed to confirm that red wave ii has completed and red wave iii to above 1.7484 is developing.

    Short-term, we see support at 1.7262 and again at 1.7238. The later will ideally be able to protect the downside for the break above 1.7355 towards 1.7484 and above, with the next important targets seen at 1.7924 and 1.8369.

    R3: 1.7484
    R2: 1.7417
    R1: 1.7355
    Pivot: 1.7299
    S1: 1.7270
    S2: 1.7243
    S3: 1.7220

    Trading recommendation: We are long EUR from 1.7245 with our stop placed at 1.7215.

    Analysis are provided byInstaForex.
    Best regards, PR Manager
    Learn more about InstaForex Company at http://instaforex.com

  9. #259
    Senior Member InstaForex Gertrude's Avatar
    Join Date
    Sep 2015
    Posts
    1,885
    Elliott wave analysis of EUR/NZD for August 20, 2018


    Nothing happening here. The range-trading between 1.7220 and 1.7310 continues to dominate the picture. We continue to look for a break above resistance at 1.7310 and more importantly a break above resistance at 1.7355 that confirms red wave ii has completed and red wave iii has taken over for the next impulsive rally towards 1.7924 and 1.8369 as the next larger upside targets.

    R3: 1.7484
    R2: 1.7417
    R1: 1.7355
    Pivot: 1.7310
    S1: 1.7270
    S2: 1.7243
    S3: 1.7220

    Trading recommendation:
    We are long EUR from 1.7245 with our stop placed at 1.7215.

    Analysis are provided byInstaForex.
    a
    Best regards, PR Manager
    Learn more about InstaForex Company at http://instaforex.com

  10. #260
    Senior Member InstaForex Gertrude's Avatar
    Join Date
    Sep 2015
    Posts
    1,885
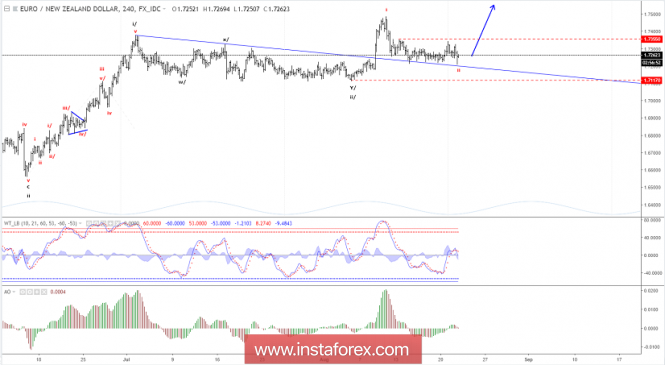
    Elliott wave analysis of EUR/NZD for August 22, 2018


    EUR/NZD once again failed to break above important short-term resistance at 1.7355 and instead turned around to make a small new low at 1.7211. This is a disappointment and keeps red wave ii alive, but it does not change our larger bullish count calling for more upside pressure above 1.7484 longer-term. To confirm that red wave ii has completed, we still need a break above resistance at 1.7355 and as long as this short-term important resistance remains able to cap the upside, red wave ii could dip closer to 1.7196, but the potential downside should be limited to here for a break above minor resistance at 1.7327 and more importantly a break above 1.7355 confirming red wave iii is developing for a rally above 1.7484.

    R3: 1.7355
    R2: 1.7327
    R1: 1.7275
    Pivot: 1.7255
    S1: 1.7221
    S2: 1.7196
    S3: 1.7162

    Trading recommendation:
    Ous stop was hit for a small loss of 20 pips. We will re-buy EUR at 1.7205 or upon a break above 1.7327 and place our stop at 1.7200.

    Analysis are provided byInstaForex.
    Best regards, PR Manager
    Learn more about InstaForex Company at http://instaforex.com

Page 26 of 180 FirstFirst ... 16 24 25 26 27 28 36 76 126 ... LastLast

Tags for this Thread

Bookmarks

Posting Permissions

  • You may not post new threads
  • You may not post replies
  • You may not post attachments
  • You may not edit your posts
  •