Page 116 of 128 FirstFirst ... 16 66 106 114 115 116 117 118 126 ... LastLast
Results 1,151 to 1,160 of 1272
Like Tree3Likes

Forex News Analysis by LiteForex

This is a discussion on Forex News Analysis by LiteForex within the Analytics and News forums, part of the Trading Forum category; EUR/USD: EUR is strengthening Current trend EUR is climbing again against USD during today's Asian session, recovering from a slight ...


  1. #1151
    Senior Member MikhailLF's Avatar
    Join Date
    Sep 2017
    Posts
    830
    EUR/USD: EUR is strengthening

    Current trend

    EUR is climbing again against USD during today's Asian session, recovering from a slight decline last Friday, which was triggered by the emergence of corrective sentiment in the market. USD positions remain under pressure, as the fundamental picture has changed slightly recently. Investors are concerned about the deteriorating epidemiological situation in the USA, which may eventually lead to additional budget spending and new restrictive measures, which have been diligently avoided by Donald Trump's administration.

    However, investors pin their main hopes on the development of a vaccine against coronavirus. Unverified information appears in the media that vaccination of Americans may begin as early as December. Today, traders are focused on the publication of statistics on business activity in the euro area (Germany and France separately) for November. The indices in the manufacturing and services sector are expected to decline, which will be the projected response to restrictive measures in many EU countries.

    Support and resistance

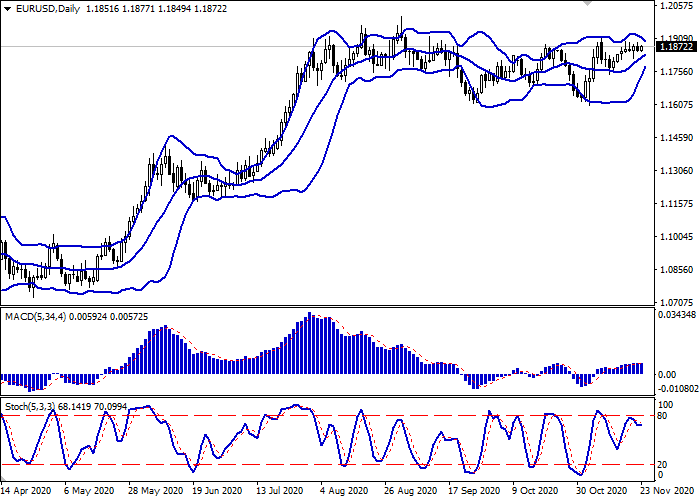
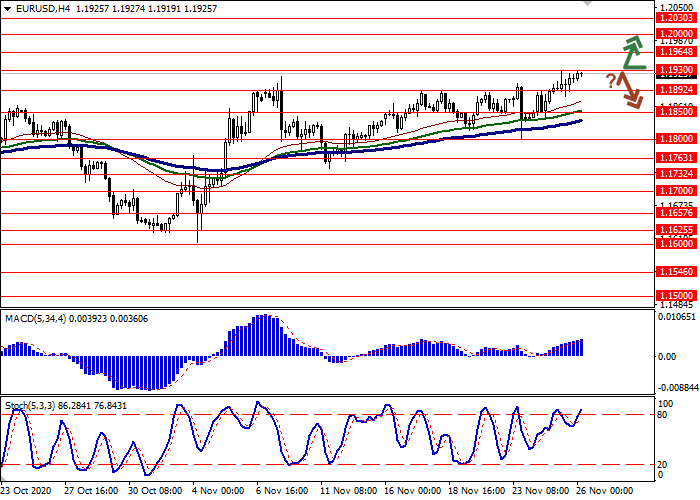
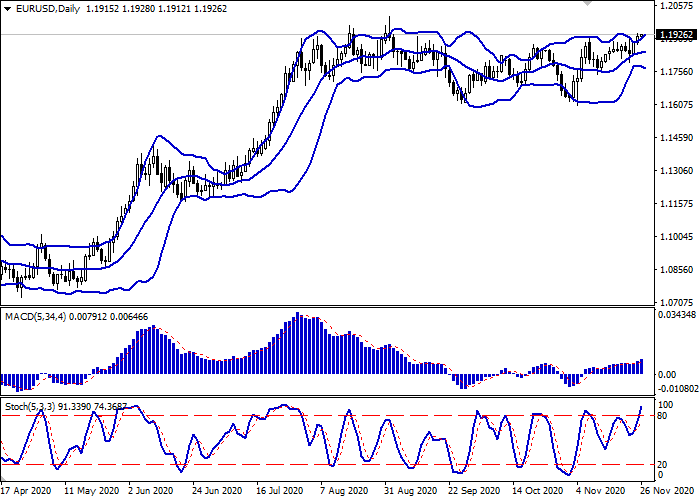
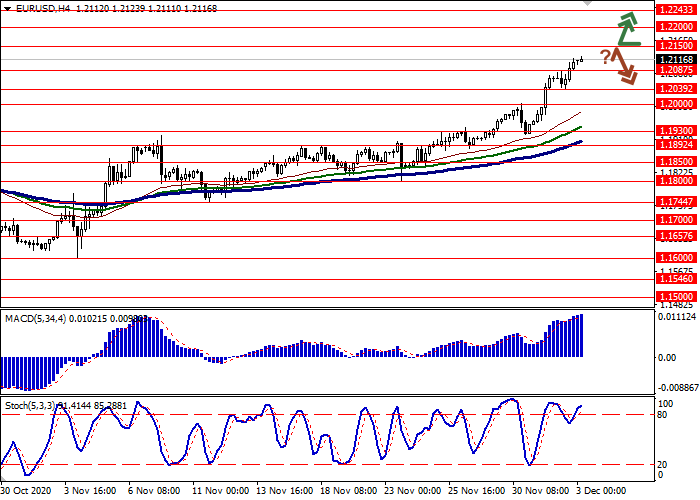
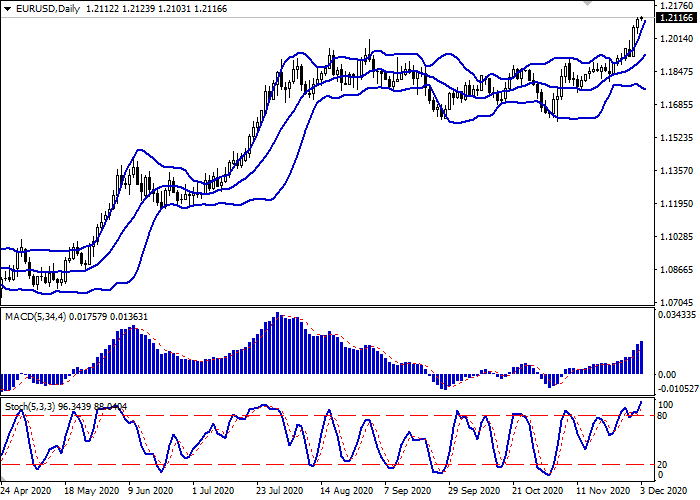
    Bollinger Bands in D1 chart show moderate growth. The price range is actively narrowing, pointing at the flat nature of trading in the short term. MACD indicator is growing preserving a weak buy signal (located above the signal line). Stochastic, having retreated from the level of "80", reversed into a horizontal plane, indicating fragile balance of power in the ultra-short term.

    To open new trading positions, it is necessary to wait for the signals from technical indicators to be clarified.

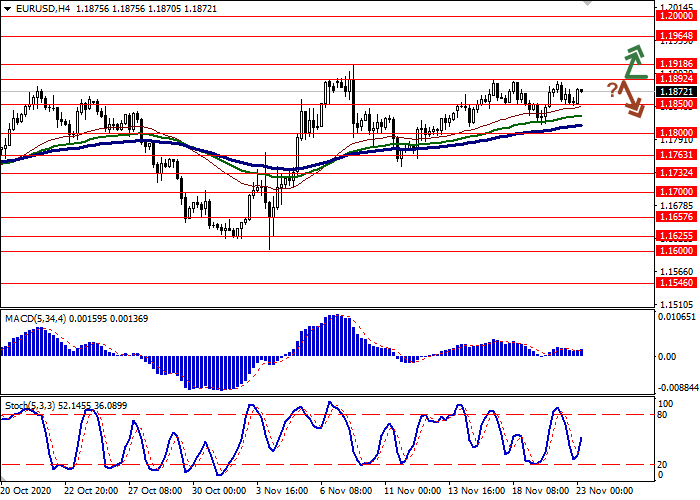
    Resistance levels: 1.1892, 1.1918, 1.1964, 1.2000.
    Support levels: 1.1850, 1.1800, 1.1763.


  2. #1152
    Senior Member MikhailLF's Avatar
    Join Date
    Sep 2017
    Posts
    830
    EUR/USD

    The pair is in a correction and may grow.

    On the daily chart, the first wave of the higher level 1 of (3) develops, within which a downward correction ended as the wave iv of 1. Now, the fifth wave v of 1 is developing, within which the first entry wave of the lower level (i) of v has formed, and a local correction is developing as the wave (ii) of v. If the assumption is correct, after the end of the correction, the pair will grow to the levels of 1.2060–1.2200. In this scenario, critical stop loss level is 1.1724.


  3. #1153
    Senior Member MikhailLF's Avatar
    Join Date
    Sep 2017
    Posts
    830
    GBP/USD: GBP updates local highs

    Current trend

    GBP is trading with multidirectional dynamics against USD at today's morning session, consolidating near 1.3350 and local highs since September 2, updated at the beginning of this week. GBP is supported by further weakening of USD against the backdrop of rather optimistic news from the US. Investors are reacting to the long-awaited start of the transfer of power from Donald Trump's administration, which is likely to prevent further aggravation of the political situation in the country. The markets were also encouraged by the reports of the possible appointment of the former Fed Chair Janet Yellen to the post of US Treasury Secretary. Yellen is expected to sharply increase fiscal spending to help lift the US economy out of the crisis caused by the epidemic.

    Further growth of GBP is limited by the approaching Brexit deadlines. The Bank of England Governor, Andrew Bailey, warned the markets, saying that the country's exit from the EU without a deal could be "worse than COVID-19".

    Support and resistance

    Bollinger Bands in D1 chart show stable growth. The price range is expanding from above, having difficulty keeping pace with the development of the "bullish" trend in recent days. MACD indicator is growing preserving an unsteady buy signal (located above the signal line). Stochastic, approaching the level of "80", reversed into a horizontal plane, reacting to risks associated with overbought GBP in the ultra-short term.

    Existing long positions should be kept until technical indicators are clarified.

    Resistance levels: 1.3400, 1.3481, 1.3550.
    Support levels: 1.3311, 1.3250, 1.3200, 1.3125.


  4. #1154
    Senior Member MikhailLF's Avatar
    Join Date
    Sep 2017
    Posts
    830
    EUR/USD: EUR updates September highs

    Current trend

    EUR shows a slight increase against USD today, trading near local highs of early September, updated the day before. EUR is still supported by fairly optimistic market sentiments related to the start of the transfer of power in the USA, as well as the expectation of the imminent start of the coronavirus vaccination campaign. Also yesterday, the market received interesting macroeconomic statistics from the US.

    USD was under pressure from the data on the number of Initial Jobless Claims. For the week ending November 20, Initial Jobless Claims again increased from 748K to 778K, while analysts expected it to decrease to 730K. Continuing Jobless Claims for the week ending November 13 decreased from 6.37M to 6.071M, which turned out to be slightly worse than the market forecasts of a decrease to 6.02M.

    Today, European investors are focused on the speeches by the ECB representatives, Philip Lane and Isabel Schnabel. Also during the day, the European regulator is to publish the minutes of its last meeting on monetary policy.

    Support and resistance

    In the D1 chart, Bollinger Bands are reversing horizontally. The price range is expanding but it fails to conform to the development of "bullish" sentiments at the moment. MACD indicator is growing preserving a rather stable buy signal (located above the signal line). Stochastic retains upward direction but is located near its highs, which indicates the overbought EUR in the ultra-short term.

    Resistance levels: 1.1930, 1.1964, 1.2000, 1.2030.
    Support levels: 1.1892, 1.1850, 1.1800, 1.1763.


  5. #1155
    Senior Member MikhailLF's Avatar
    Join Date
    Sep 2017
    Posts
    830
    GBP/USD: wave analysis

    The pair may grow.

    On the 4-hour chart, the first wave of the higher level (1) develops, within which the wave 5 of (1) forms. Now, the third wave of the lower level iii of 5 is developing, within which the wave (v) of iii is forming. If the assumption is correct, the pair will grow to the levels of 1.3490–1.3700. In this scenario, critical stop loss level is 1.3267.


  6. #1156
    Senior Member MikhailLF's Avatar
    Join Date
    Sep 2017
    Posts
    830
    XAU/USD: five-month lows updated

    Current trend

    Gold prices are showing a steady decline in today's trading, renewing their lows since July 2. The instrument got an opportunity to consolidate below the psychological level of 1800.00, responding to the growing positive sentiment regarding political and economic changes in the USA with the arrival of the Joe Biden administration. Pressure on safe gold is also coming from the growing prospect of tackling COVID-19 through the launch of a massive vaccination campaign, although it will certainly take a long time given the amount of vaccine needed and the rush to develop it.

    In turn, some support for gold is provided by the possible prospects for another easing of monetary policy by the world's leading regulators in December, especially from the Fed and the ECB.

    Support and resistance

    Bollinger Bands in D1 chart demonstrate a stable decrease. The price range is expanding from below; however, it fails to catch the development of "bearish" trend at the moment. MACD is actively going down preserving a stable sell signal (located below the signal line). Stochastic, having reached its lows, reversed into the horizontal plane, indicating growing risks of corrective growth in the short and/or ultra-short term.

    To open new positions, it is necessary to wait for the trade signals to become clear. Existing short positions should be kept in the short term.

    Resistance levels: 1779.09, 1800.00, 1811.96, 1830.00.
    Support levels: 1753.57, 1735.13, 1720.00, 1700.00.


  7. #1157
    Senior Member MikhailLF's Avatar
    Join Date
    Sep 2017
    Posts
    830
    XAG/USD: wave analysis

    The pair may fall.

    On the daily chart, the first wave of the higher level 1 of (3) formed, and a downward correction develops as the wave 2 of (3). Now, the wave a of 2 has formed, the wave b of 2 has developed, and of the wave c of 2 is forming. If the assumption is correct, the price will fall to the levels of 20.52–18.28. In this scenario, critical stop loss level is 25.05.


  8. #1158
    Senior Member MikhailLF's Avatar
    Join Date
    Sep 2017
    Posts
    830
    USD/CAD: USD remains under pressure

    Current trend

    USD shows multidirectional trading against CAD in today's Asian session, slightly correcting after an active decline the day before, which returned the instrument to the area of local lows since October 2018. USD is under pressure from the worsening epidemiological situation, as well as not the most confident macroeconomic statistics on business activity in the US manufacturing sector. The reduction of the instrument the day before was also facilitated by the speech of the Fed Chair Jerome Powell in the Congress. Powell warned that the country will face several "difficult" months ahead, since it is not yet possible to count on a quick solution to the coronavirus issue, and the economy already needs additional support.

    In turn, Canadian data managed to support the market. Canada's annualized GDP in Q3 2020 grew by an impressive 40.5% QoQ after falling by 38.1% QoQ last month. However, the market forecasts assumed that the Canadian economy will grow by 47.6% QoQ. Markit Manufacturing PMI in Canada in November rose from 55.5 to 55.8 points, in line with the forecasts.

    Support and resistance

    Bollinger Bands in D1 chart demonstrate a moderate decrease. The price range is slightly widening from below but does not conform to the development of the "bearish" trend yet. MACD is going down preserving a moderate sell signal (located below the signal line). Stochastic, on the other hand, maintains a timid uptrend, signaling that USD is oversold in the ultra-short term.

    Resistance levels: 1.2950, 1.3000, 1.3050, 1.3100.

    Support levels: 1.2900, 1.2850, 1.2800.


  9. #1159
    Senior Member MikhailLF's Avatar
    Join Date
    Sep 2017
    Posts
    830
    EUR/USD: updating record highs

    Current trend

    EUR is trading ambiguously against USD during today's Asian session, consolidating near 1.2120 and all-time highs since April 2018. EUR maintains its "bullish" momentum, receiving support from a weak USD; however, technical factors and the coming weekend provoke traders to close some of their long positions. Macroeconomic statistics from Europe published yesterday turned out to be moderately optimistic. Investors were most pleased with data from Germany, which reflected a 2.6% MoM growth in October retail sales after a 2.2% MoM decline in the previous month. Analysts had expected growth of 1.2% MoM. In annual terms, sales added 8.2% YoY, which also turned out to be noticeably better than market forecasts at +5.9% YoY.

    Today, investors are focused on business activity statistics in the euro area for November.

    Support and resistance

    Bollinger Bands in D1 chart show stable growth. The price range is expanding; however, it fails to catch the development of "bullish" trend at the moment. MACD indicator is growing keeping a strong buy signal (located above the signal line). Stochastic retains its upward direction but is located near its highs, which indicates risks of overbought EUR in the ultra-short term.

    Technical indicators do not contradict the further development of the uptrend.

    Resistance levels: 1.2150, 1.2200, 1.2243.
    Support levels: 1.2087, 1.2039, 1.2000, 1.1930.


  10. #1160
    Senior Member MikhailLF's Avatar
    Join Date
    Sep 2017
    Posts
    830
    Brent Crude Oil: wave analysis

    The price may grow.

    On the daily chart, a downward correction of the higher level developed as the wave B, and the formation of the upward wave C started, within which the first wave 1 of (1) of C develops. Now, the third wave of the lower level iii of 1 is forming, within which the wave (ii) of iii has ended. If the assumption is correct, the price will grow to the levels of 59.92–71.40. In this scenario, critical stop loss level is 46.60.


Page 116 of 128 FirstFirst ... 16 66 106 114 115 116 117 118 126 ... LastLast

Tags for this Thread

Bookmarks

Posting Permissions

  • You may not post new threads
  • You may not post replies
  • You may not post attachments
  • You may not edit your posts
  •