Page 114 of 128 FirstFirst ... 14 64 104 112 113 114 115 116 124 ... LastLast
Results 1,131 to 1,140 of 1272
Like Tree3Likes

Forex News Analysis by LiteForex

This is a discussion on Forex News Analysis by LiteForex within the Analytics and News forums, part of the Trading Forum category; EUR/USD: EUR is declining Current trend EUR shows moderate decline against USD today, retreating from local highs since September 16, ...


  1. #1131
    Senior Member MikhailLF's Avatar
    Join Date
    Sep 2017
    Posts
    830
    EUR/USD: EUR is declining

    Current trend

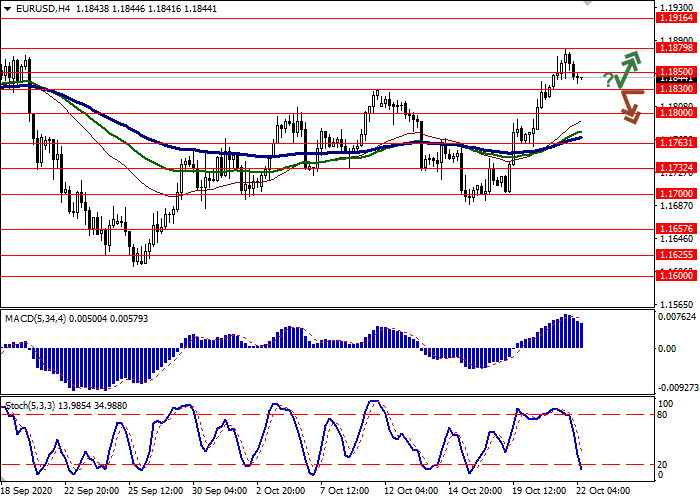
    EUR shows moderate decline against USD today, retreating from local highs since September 16, updated the day before. Technical factors were the reason for the appearance of the "bearish" trend for the instrument, while USD remains under pressure amid expectations of new measures to support the American economy.

    The deadline for the ultimatum put forward by the House of Representatives Speaker Nancy Pelosi expired the day before, but she chose to extend the deadline for one more day. In turn, Donald Trump has stepped up pressure on the Republican Party in an attempt to approve a larger aid package.

    On Thursday, in addition to news regarding the long-awaited stimulus measures for the US, investors expect the publication of data on jobless claims in the US. Interesting data from Europe will appear on Friday, when the business activity indicators for October are released in Germany and the eurozone.

    Support and resistance

    Bollinger Bands in D1 chart show moderate growth. The price range is expanding from above, but it fails to catch the development of "bullish" trend at the moment. MACD indicator is growing preserving a stable buy signal (located above the signal line). Stochastic keeps the uptrend but is approaching its highs, which reflects the risks of overbought EUR in the ultra-short term.

    Technical indicators do not contradict the further development of the "bullish" trend in the short and/or ultra-short term.

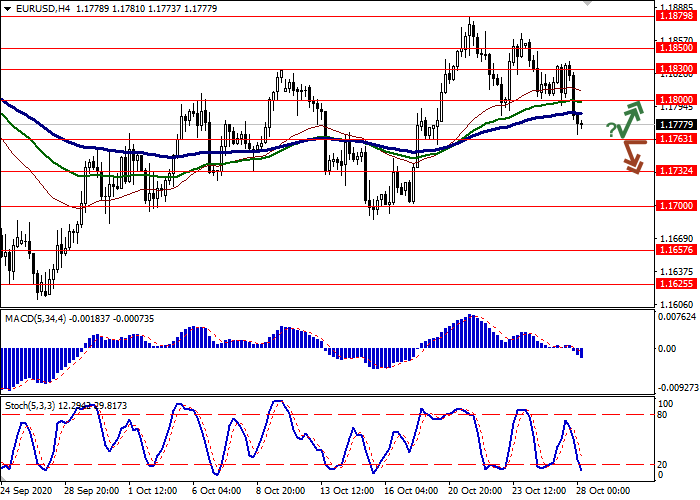
    Resistance levels: 1.1850, 1.1879, 1.1916, 1.1950.

    Support levels: 1.1830, 1.1800, 1.1763, 1.1732.


  2. #1132
    Senior Member MikhailLF's Avatar
    Join Date
    Sep 2017
    Posts
    830
    Morning Market Review

    EUR/USD

    EUR is falling against USD during today's Asian session, again consolidating near local highs, updated in the middle of last trading week. The pressure on EUR remains amid the ambiguous prospects for the global economy, which faced a second wave of COVID-19 and a number of restrictions imposed mainly by European countries. Macroeconomic statistics on business activity in the eurozone released last Friday were disappointing. Markit Services PMI in October declined from 48 to 46.2 points with the forecast of the decline to 47 points. At the same time, Manufacturing PMI for the same period increased from 53.7 to 54.4 points, which turned out to be better than the forecasts of growth to 53.1 points. The Composite PMI in October fell below the psychological level of 50 points to 49.4 points, which, in general, was in line with market expectations.

    GBP/USD

    GBP is trading with negative dynamics against USD since the opening of a new trading week, developing a fairly strong "bearish" momentum, which was formed in the middle of last week. The instrument almost completely ignored the strong UK Retail Sales statistics released on October 23. The data reflected Retail Sales growth by 1.5% MoM in September after rising by 0.9% MoM in the previous month. Analysts had expected a slowdown in the index to 0.4% MoM. On an annualized basis, sales rose by 2.7% to 4.7% YoY, which was also better than average forecasts of 3.7% YoY. Business activity statistics were significantly worse. Markit Manufacturing PMI fell in October from 54.1 to 53.3 points, which was only 0.2 points better than market expectations. Services PMI fell from 56.1 to 52.3 points with the forecast of falling to 54 points.

    AUD/USD

    AUD declines against USD during today's morning session, correcting after an uncertain rise in the instrument at the end of the last trading week. The pair is under pressure from the corrective growth of USD, while the fundamental picture of the market changes insignificantly. AUD also reacts sluggishly to the macroeconomic statistics from Australia released on Monday. Exports from Australia increased by 3% in September after falling by 4.2% in the previous month. Imports for the same period fell by 1% after rising by 2% in August. Such a significant discrepancy between the dynamics of imports and exports led to an increase in the trade surplus almost doubled, from AUD 2.643B to AUD 5.114B. Today, investors are focused on statistics from the United States on the dynamics of New Home Sales and Chicago Fed National Activity Index for September.

    USD/JPY

    USD has shown strong gains against JPY during today's Asian session, preparing to test the strong resistance at 105.00. Moderate support for USD is provided by the macroeconomic statistics from the US on business activity published at the end of the last trading week. Markit Manufacturing PMI in October showed a slight increase from 53.2 to 53.3 points, which fell slightly short of market expectations. In turn, Services PMI for the same period increased from 54.6 to 56 points, while analysts did not expect any changes in the indicator at all. Markit Composite PMI in October rose from 54.3 to 55.5 points.

    XAU/USD

    Gold prices show flat dynamics during today's morning session, consolidating near 1900.00. The instrument has been declining since last Thursday, when USD managed to show corrective growth in response to mixed messages regarding the new economic stimulus package in the US. After repeatedly saying that it would be extremely difficult to reach an agreement before the November US elections, House Speaker Nancy Pelosi announced "significant progress" on the deal and said new measures could be approved "very soon". The presidential elections in the United States will take place next week, on November 3.

  3. #1133
    Senior Member MikhailLF's Avatar
    Join Date
    Sep 2017
    Posts
    830
    WTI Crude Oil: oil weakens again

    Current trend

    Oil prices continue to decline, trading around 38.60.

    It looks like COVID-19 will again intervene in OPEC's long-term plans. During the next meeting, which is scheduled for November, the OPEC countries were expected to discuss the issue of increasing quotas for oil production by 2 million barrels per day but there is less hope for this. The second wave of the pandemic provokes new restrictive measures that negatively affect demand. Additional difficulties were created by Libya, which plans to increase production by 800K barrels over the next two weeks, and by 1 million barrels within a month.

    In general, experts assess the supply on the oil market as overstated, and with the current demand, the asset's quotes will continue to decline further.

    Support and resistance

    The corrective movement continues within the local sideways channel, within which the price forms a new wave of decline. Technical indicators reversed and gave a clear sell signal. Alligator indicator’s EMA fluctuations range is expanding towards decline, and the histogram of the AO oscillator is trading in the negative zone.

    Resistance levels: 39.00, 41.30.
    Support levels: 38.20, 36.50.


  4. #1134
    Senior Member MikhailLF's Avatar
    Join Date
    Sep 2017
    Posts
    830
    EUR/USD: the euro is declining

    Current trend

    EUR has been declining against USD during today's Asian trading session, building on the "bearish" momentum that formed earlier this week. Risk demand remains under pressure again amid an alarming rise in the global incidence of COVID-19.

    Investors are also disappointed with the approval process for a new stimulus package for the US economy. Despite all the efforts of US lawmakers, it seems that there will be no results before the November elections. The Senate majority leader Mitch McConnell decided to postpone the meeting until November 9, which practically puts an end to the last hopes of reaching agreement on the deal. The bailout and stimulus package was not approved due to the principled position of the Senate, which did not agree to Donald Trump's proposal to approve a larger aid package.

    Support and resistance

    In the D1 chart, Bollinger Bands are reversing horizontally. The price range consolidated within rather wide boundaries, which correspond to the observed dynamics in the market. MACD is going down preserving a moderate sell signal (located below the signal line). Stochastic is declining almost vertically, rapidly approaching its lows, indicating the risks of oversold EUR in the ultra-short term.

    Existing short positions should be kept until technical indicators are clarified.

    Resistance levels: 1.1800, 1.1830, 1.1850, 1.1879.
    Support levels: 1.1763, 1.1732, 1.1700, 1.1657.


  5. #1135
    Senior Member MikhailLF's Avatar
    Join Date
    Sep 2017
    Posts
    830
    XAG/USD: general review

    Current trend

    Silver prices are showing modest gains during today's morning trading session, correcting after a strong decline the day before, which led to renewed local lows since October 7. Investors are worried about new restrictions that more and more European countries are imposing in response to increasing epidemiological risks. A serious increase in the incidence is also observed in the US, where presidential elections are to be held on November 3. The market seems to have come to terms with the fact that there is no time left to approve new support measures for the American economy before the elections, and the main intrigue now is whether Donald Trump will be able to arrange the approval of the agreement after the vote count.

    Today, investors await the publication of updated data on the dynamics of Initial Jobless Claims in the USA, as well as the data on the US GDP for Q3 2020.

    Support and resistance

    Bollinger Bands in D1 chart demonstrate a moderate decrease. The price range is expanding from below; however, it fails to catch the surge of the "bearish" sentiment at the moment. MACD is going down keeping a fairly stable sell signal (located below the signal line). Stochastic, having approached the level of "20" is reversing upwards, signaling in favor of the development of corrective growth in the ultra-short term.

    To open new trading positions, it is necessary to wait for the signals from technical indicators to be clarified.

    Resistance levels: 23.60, 24.00, 24.37, 25.00.
    Support levels: 23.00, 22.40, 21.63, 21.00.


  6. #1136
    Senior Member MikhailLF's Avatar
    Join Date
    Sep 2017
    Posts
    830
    GBP/USD: the instrument is declining

    Current trend

    GBP is trading near zero against USD during today's Asian trading session, consolidating near 1.2900, which was actively tested the day before. Quite good data from the USA provided some support to USD yesterday. The dynamics of US GDP in Q3 2020 showed a steady growth of 33.1% YoY, fully compensating for an equally active decline of 31.4% in the previous quarter. Analysts had expected growth rate at 31% YoY. Initial Jobless Claims for the week ending October 23 fell from 791K to 751K, which turned out to be better than the projected 775K.

    British investors, in turn, reacted negatively to the fall in Consumer Credit in September by GBP 0.6B after rising by GBP 0.285B last month. Analysts expected growth of GBP 0.75B.

    Support and resistance

    In the D1 chart, Bollinger Bands are reversing horizontally. The price range is expanded from below reflecting rise of "bearish" sentiment in the short term. MACD is going down preserving a stable sell signal (located below the signal line). The indicator is trying to consolidate below the zero level. Stochastic keeps a confident downward direction but is already approaching its lows, which indicates the risks of oversold GBP in the ultra-short term.

    Existing short positions should be kept until technical indicators are clarified.

    Resistance levels: 1.2960, 1.3000, 1.3081, 1.3125.
    Support levels: 1.2900, 1.2850, 1.2800, 1.2761.


  7. #1137
    Senior Member MikhailLF's Avatar
    Join Date
    Sep 2017
    Posts
    830
    USD/CAD: the pair grows

    Current trend

    The USD/CAD pair slightly grows amid lower USD activity, trading at 1.3340.

    The American market is almost completely frozen. Trading volume and USD Index fell to their lows since the beginning of the year. Tomorrow, the most anticipated event of the year will take place – the US presidential election. Although most preliminary polls point to Joe Biden's victory, nothing has been decided yet since previously, the situation was the same with Hillary Clinton, who was also far ahead of Donald Trump in polls.

    Canada's economy continues to recover smoothly, approaching pre-pandemic levels. The GDP level for August reached 1.2%, and the indicator has been growing for the fourth month in a row. The levels of production of goods and services increased by 0.5% and 1.5%, respectively, while the price indices for goods and raw materials slightly decreased to –0.1% and –2.2%. 15 industrial sectors out of 20 strengthened, and 2 of them did not change.

    Support and resistance

    On the global chart, a rare pattern of candlestick analysis Volume candlestick has formed, which is quite logical, given the fundamental background. For the pattern, the direction of price movement is not important, and pending orders should be placed in both directions. Technical indicators are in purchase. Fast EMAs on the Alligator indicator crossed the signal one upwards, and the AO oscillator histogram entered the buy zone.

    Resistance levels: 1.3389, 1.3468.
    Support levels: 1.3277, 1.3225.


  8. #1138
    Senior Member MikhailLF's Avatar
    Join Date
    Sep 2017
    Posts
    830
    WTI Crude Oil: a new growth wave

    Current trend

    The oil price came to a standstill after a sharp rise, trading near the level of 36.70.

    The oil market is at extremely low levels, and traders’ hopes were focused on the new parameters of the OPEC+ deal, which assumed an increase in production volumes from the beginning of 2021 in proportion to the increase in demand. However, demand is declining more and more, so only new reductions are being discussed.

    On Friday, OPEC published production levels in its member countries. As the data showed, most countries reduced it according to the last monitoring committee meeting’s plan, and growth is observed only in Libya, which is also expected. The volume of production there amounted to 0.16 million against 0.11 million earlier. The largest reduction was achieved in the UAE, where production is 2.53 million barrels per day against 2.71 million earlier. Saudi Arabia also slightly increased production, where it is 8.96 million barrels per day against the background of 8.89 million a month earlier.

    Support and resistance

    The corrective movement continues within the global sideways channel, within which the price forms a new growth wave. Technical indicators remain in a sell signal state. Alligator indicator’s EMA fluctuations range begins to narrow, and the histogram of the AO oscillator moves in the negative zone.

    Resistance levels: 37.90, 42.00.
    Support levels: 34.20, 28.70.


  9. #1139
    Senior Member MikhailLF's Avatar
    Join Date
    Sep 2017
    Posts
    830
    Current trend

    The USD/JPY pair continues to correct downward, trading at 104.30.

    The Japanese currency began to actively win back yesterday's losses from the very morning. Service PMI for October, released in the morning, was positive, rising unexpectedly to 47.7 points against the forecast of 46.9 points. Yesterday, the Monetary Policy Committee met to focus on the impact of the pandemic on Japanese growth. According to the committee's forecasts, economic growth by the end of the year will slow down by a value in the range of –5.6% to –5.3%, and in 2021 it will again recover to the levels of 3.0–3.8%.

    The US dollar lost its positive momentum. The preliminary election results, which were positive for Donald Trump, threaten to turn into defeat. According to the election headquarters, Joe Biden is already gaining 264 electoral votes, while Trump has only 214. Trump has already begun to actively declare fraud and readiness to sue to review the results in key states, where he first won but then unexpectedly lost.

    Support and resistance

    The global downtrend continues to form within the downtrend channel, within which another wave of decline is forming. Technical indicators are in a global sale state. Fast EMAs of the Alligator indicator are below the signal one, and the histogram of the AO oscillator is trading deep in the negative zone.

    Resistance levels: 104.70, 105.30.
    Support levels: 104.15, 103.00.


  10. #1140
    Senior Member MikhailLF's Avatar
    Join Date
    Sep 2017
    Posts
    830
    Brent Crude Oil: oil is weakening
    Current trend

    Oil prices began to decline again, dropping to $39.50 per barrel.

    EIA data on oil reserves confirmed OPEC's negative scenario. The indicator fell by 7.998 million barrels against the background of the expected increase in reserves by 0.890 million. These data did not have a positive effect on the instrument. On the contrary, investors began to expect with even greater concern the data correction next week. Yesterday, Saudi Aramco said it would cut its December selling prices for Asian buyers. The company decided to take such a step due to a decrease in demand for the company's products under the influence of the second wave of the COVID-19 pandemic.

    It is becoming more and more obvious that at the OPEC meeting to be held in mid-November, the main issue will be a new cut in production volumes, which the Russian Federation is actively opposing so far.

    Support and resistance

    On the local chart, the price moves within the local Expanding formation pattern, within which it approaches the resistance line. Technical indicators are in the state of a sell signal but are starting to slow down. The range of fluctuations of the EMA indicator Alligator begins to narrow, and the histogram of the AO oscillator is approaching the buy zone.

    Resistance levels: 41.10, 43.50.
    Support levels: 38.90, 35.30.


Page 114 of 128 FirstFirst ... 14 64 104 112 113 114 115 116 124 ... LastLast

Tags for this Thread

Bookmarks

Posting Permissions

  • You may not post new threads
  • You may not post replies
  • You may not post attachments
  • You may not edit your posts
  •