
 3Likes
 LinkBack URL
 About LinkBacks


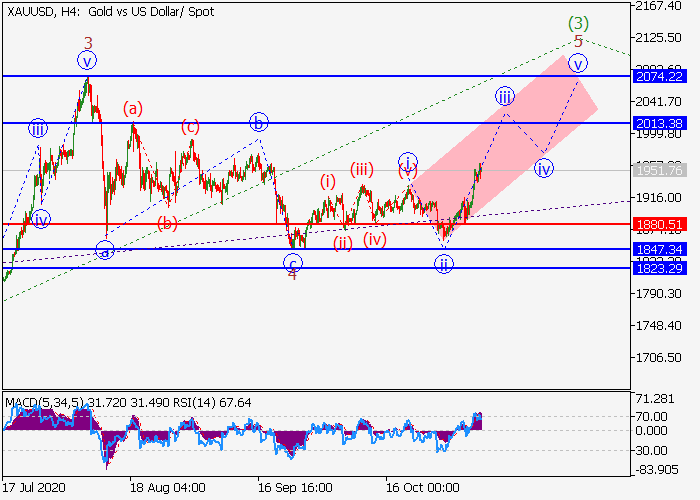
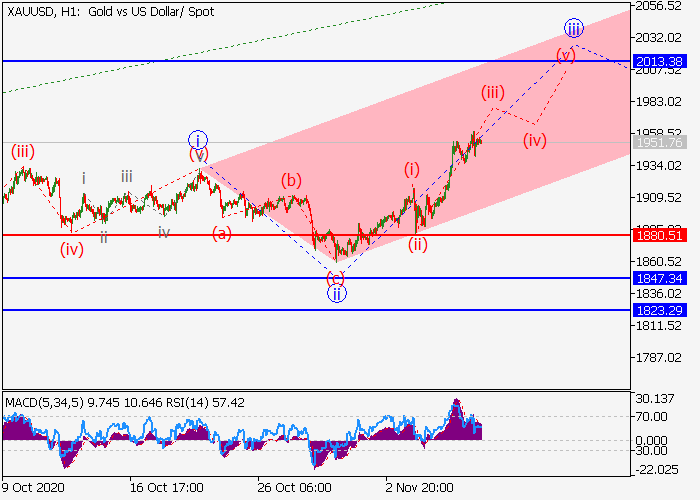
XAU/USD: wave analysis
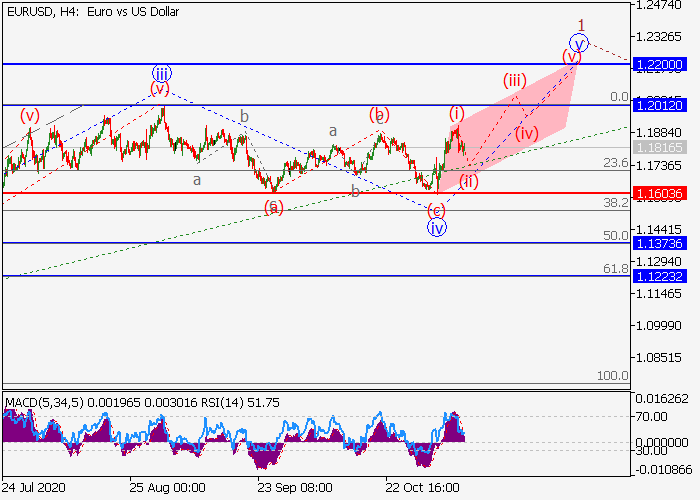
The pair may grow.
On the 4-hour chart, the third wave of the higher level (3) develops, within which the wave 5 of (3) forms. Now, the third wave of the lower level iii of 5 is forming, within which the wave (iii) of iii is developing. If the assumption is correct, the pair will grow to the levels of 2013.382074.22. In this scenario, critical stop loss level is 1880.51.


 Reply With Quote


Bookmarks