Page 125 of 128 FirstFirst ... 25 75 115 123 124 125 126 127 ... LastLast
Results 1,241 to 1,250 of 1272
Like Tree3Likes

Forex News Analysis by LiteForex

This is a discussion on Forex News Analysis by LiteForex within the Analytics and News forums, part of the Trading Forum category; JP Morgan Chase Co.: wave analysis The price may grow. On the daily chart, the fifth wave of the higher ...


  1. #1241
    Senior Member MikhailLF's Avatar
    Join Date
    Sep 2017
    Posts
    830
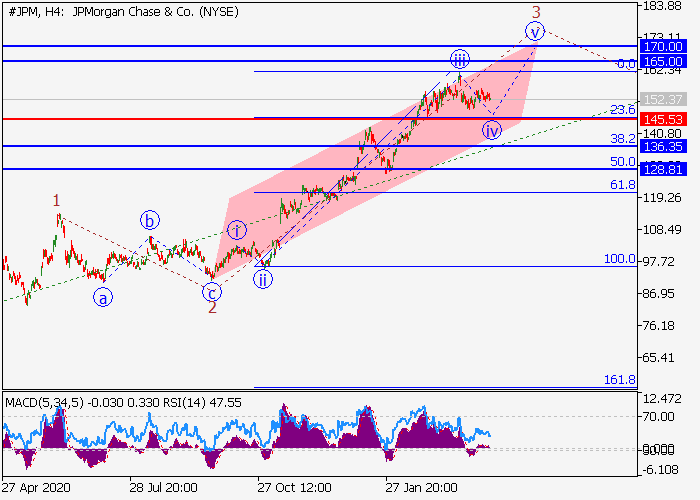
    JP Morgan Chase Co.: wave analysis

    The price may grow.

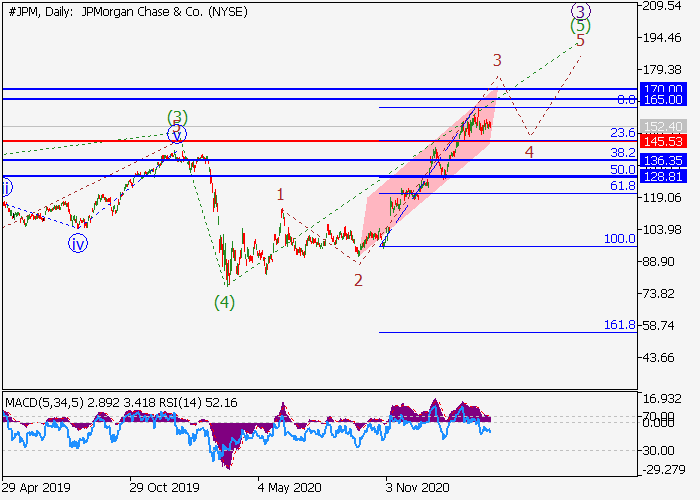
    On the daily chart, the fifth wave of the higher level (5) forms, within which the wave 3 of (5) develops. Now, the third wave of the lower level iii of 3 has formed, and a local correction is ending to develop as the fourth wave iv of 3. If the assumption is correct, after the end of the correction, the price will grow to the levels of 165.00–170.00. In this scenario, critical stop loss level is 145.53.


  2. #1242
    Senior Member MikhailLF's Avatar
    Join Date
    Sep 2017
    Posts
    830
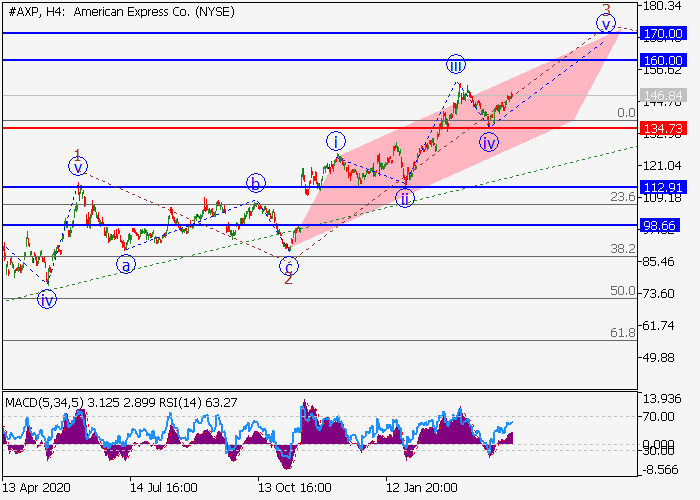
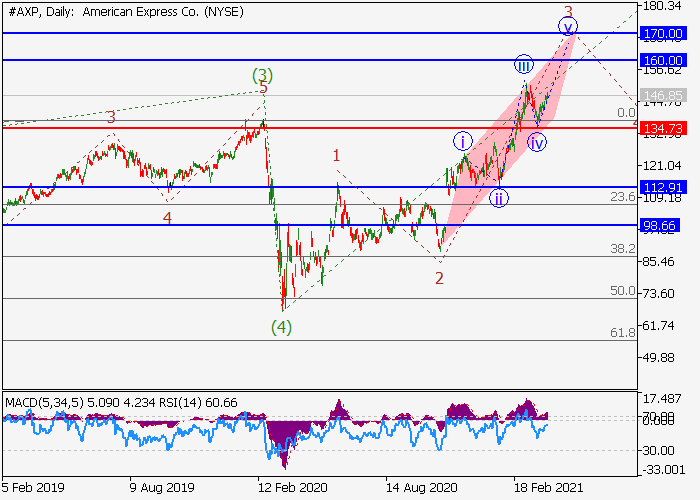
    American Express Co.: wave analysis

    The price may grow.

    On the daily chart, the fifth wave of the higher level (5) develops, within which the wave 1 of (5) formed, and the correction 2 of (5) ended. Now, the third wave 3 of (5) is developing, within which the local correction iv of 3 has developed, and the formation of the wave v of 3 has started. If the assumption is correct, the price will grow to the levels of 160.00–170.00. In this scenario, critical stop loss level is 134.73.


  3. #1243
    Senior Member MikhailLF's Avatar
    Join Date
    Sep 2017
    Posts
    830
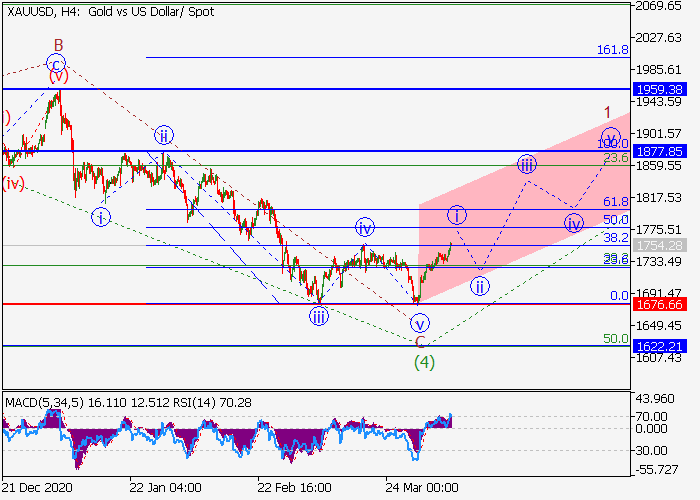
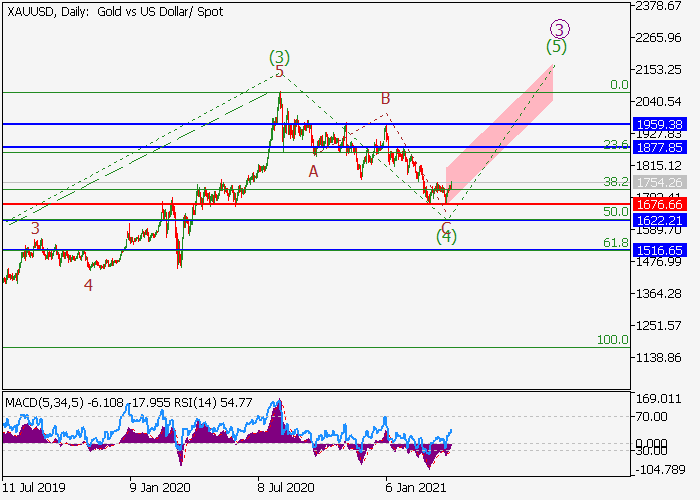
    XAU/USD: wave analysis

    The pair may grow.

    On the daily chart, the third wave of the higher level (3) formed, and a downward correction developed as the fourth wave (4). Now, the formation of the fifth wave (5) has started, within which the first wave of the lower level 1 of (5) is developing. If the assumption is correct, the pair will grow to the levels of 1877.85–1959.38. In this scenario, critical stop loss level is 1676.66.


  4. #1244
    Senior Member MikhailLF's Avatar
    Join Date
    Sep 2017
    Posts
    830
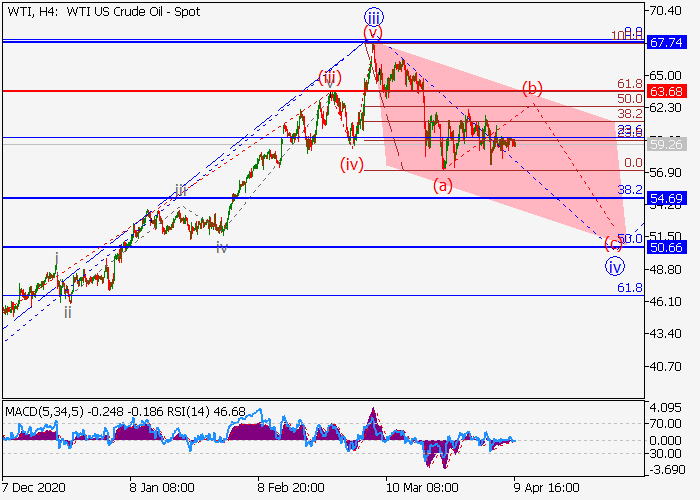
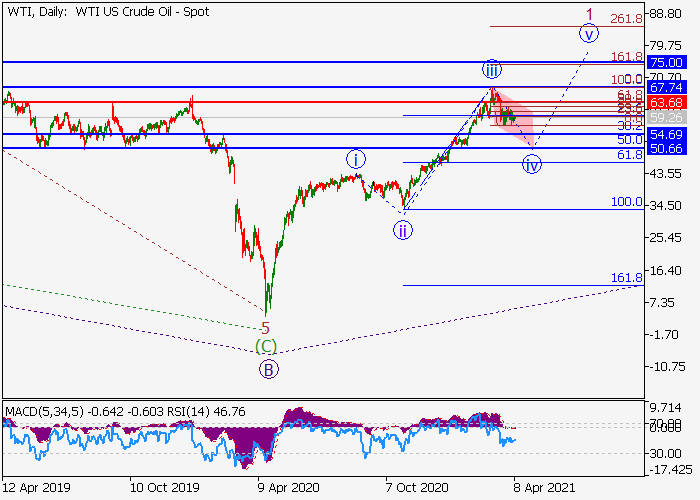
    WTI Crude Oil: wave analysis

    The price is in a correction, a fall is possible.

    On the daily chart, a downward correction of the higher level developed as the wave B, and the upward wave C forms, within which the first wave 1 of (1) of C develops. Now, the third wave of the lower level iii of 1 has formed, and a local correction is developing as the wave iv of 1, within which the wave (a) of iv has formed, and the wave (b) of iv is developing. If the assumption is correct, after the end of the correction, the price will fall to the levels of 54.69–50.66. In this scenario, critical stop loss level is 63.68.


  5. #1245
    Senior Member MikhailLF's Avatar
    Join Date
    Sep 2017
    Posts
    830
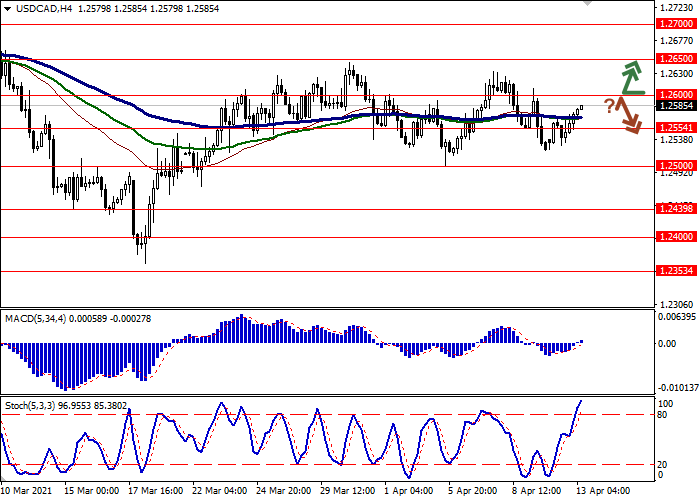
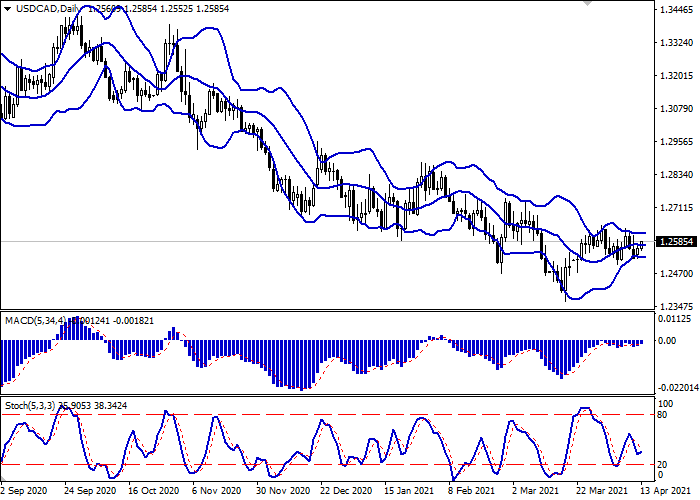
    USD/CAD: "bullish" trend development

    Current trend

    USD is showing moderate growth against CAD, developing a "bullish" signal, formed the day before, when the instrument retreated from its local lows.

    Moderate support for USD is provided by the continuing growth in the yield of US Treasury bonds, coupled with the general positive sentiment of investors regarding the prospects for the recovery of the American economy. Only statistics on inflation distorts the overall picture.

    In turn, CAD is still supported by a strong report on the Canadian labor market for March published last Friday and reflecting a sharp decline in the unemployment rate in the country from 8.2% to 7.5%, which turned out to be significantly better than market expectations of 8%. The employment change in Canada in March also rose sharply by 303.1K, outstripping the growth rate of the previous month at the level of 259.2K. Market forecasts assumed an increase of only 100K.

    Support and resistance

    In the D1 chart, Bollinger Bands are reversing horizontally. The price range does not change, outlining the approximate boundaries of the short-term flat. MACD indicator is growing, maintaining a weak buy signal (the histogram is above the signal line). Stochastic, after a short decline at the end of last week, is trying to reverse upwards, reflecting the growing buying activity in the ultra- short term.

    The development of uptrend is possible in the near future.

    Resistance levels: 1.2600, 1.2650, 1.2700.
    Support levels: 1.2554, 1.2500, 1.2439, 1.2400.

    Больше аналитики в блоге компании: https://ru.lite.forex/blog/analysts-opinions/


  6. #1246
    Senior Member MikhailLF's Avatar
    Join Date
    Sep 2017
    Posts
    830
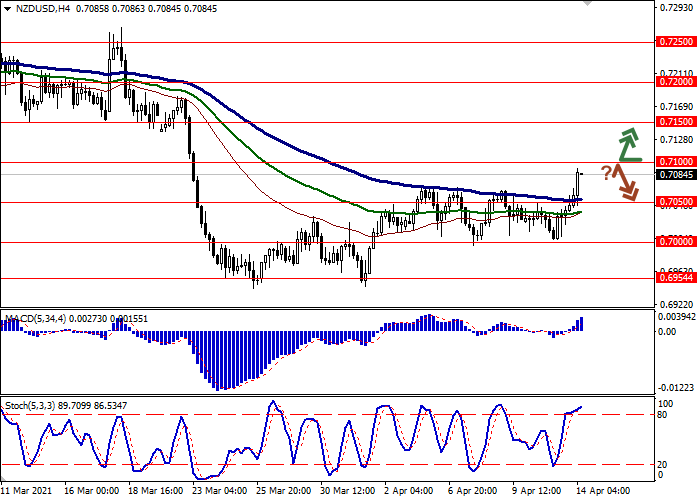
    NZD/USD: updating local highs

    Current trend

    NZD is showing active gains against USD in today’s Asian trading, building on the weak "bullish" momentum it had formed the day before. The pair adds about 0.50% and is about to test the level of 0.7100 for a breakout.

    In addition to the weak positions of USD, the decision of the Reserve Bank of New Zealand (RBNZ) on the interest rate provides moderate support to NZD. As expected, the regulator did not change the parameters of monetary policy, maintaining the key interest rate at 0.25%. In the follow-up statement, the RBNZ Monetary Policy Committee noted the continued uncertainty in the global economy amid still strong epidemiological risks and existing restrictions on tourism and supply. At the same time, the regulator is very optimistic and its current forecasts for the development of economic activity in the country are not inferior to the February estimates.

    Support and resistance

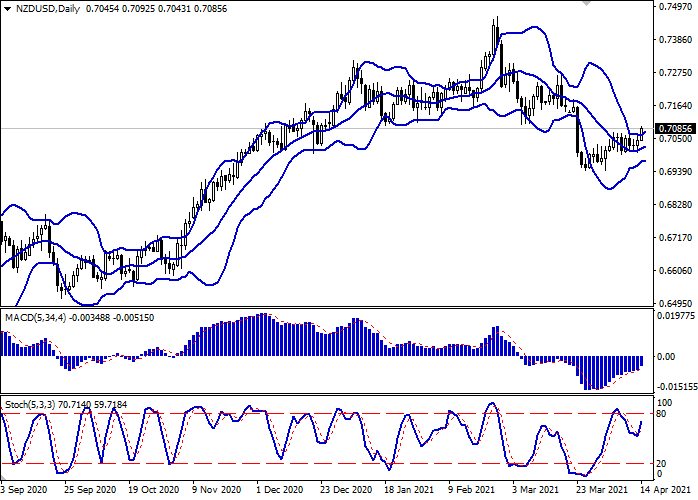
    On the D1 chart Bollinger Bands are reversing into the ascending plane. The price range is expanding but it fails to conform to the surge of "bullish" activity at the moment. MACD indicator is growing preserving a stable buy signal (located above the signal line). Stochastic is showing similar dynamics; however, the indicator line is rapidly approaching its highs, indicating the risks of overbought NZD in the ultra-short term.

    Existing long positions should be kept until technical indicators are clarified.

    Resistance levels: 0.7100, 0.7150, 0.7200, 0.7250.
    Support levels: 0.7050, 0.7000, 0.6954, 0.6913.


  7. #1247
    Senior Member MikhailLF's Avatar
    Join Date
    Sep 2017
    Posts
    830
    EUR/USD: vaccination in the EU is again in jeopardy

    Current trend

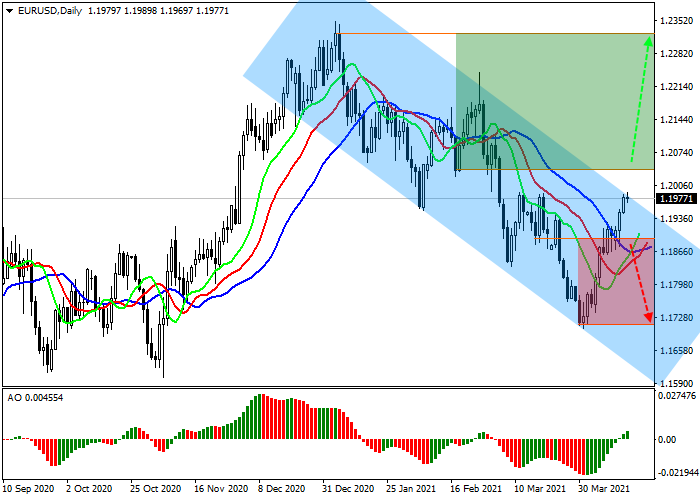
    EUR is strengthening against USD, trading at 1.1974, but the positive dynamics is mainly facilitated by weak USD.

    Vaccination problems continue in the EU. Following the AstraZeneca Plc., whose supply of the drug was disrupted, and some countries in the eurozone completely limited its use, it became known that the use of the Janssen vaccine from Johnson & Johnson Co. was also temporarily suspended because of the recently identified danger of thrombosis development. The European Medicines Agency is currently conducting analysis of the submitted samples, but there is no official conclusion yet, so a large batch of Janssen was sent to warehouses.

    USD continues to decline. The Chair of the US Fed, Jerome Powell, said yesterday that the regulator is considering the possibility of reducing the volume of purchases of government bonds, which is now USD 120B per month, and this will not be related to the course of monetary policy. In other words, the department will reduce purchases of bonds, but at the same time the key interest rate will remain unchanged. Investors were disappointed with this announcement, as the previous rise in USD was associated with hopes for a rate hike.

    Support and resistance

    On the global chart of the asset, the price continues trading within a wide descending channel. Technical indicators reversed and issued a buy signal. The fast Alligator indicator EMAs crossed the signal line from below, and the histogram of the AO oscillator moved to the purchase area.

    Resistance levels: 1.2035, 1.2325.
    Support levels: 1.1899, 1.1710.


  8. #1248
    Senior Member MikhailLF's Avatar
    Join Date
    Sep 2017
    Posts
    830
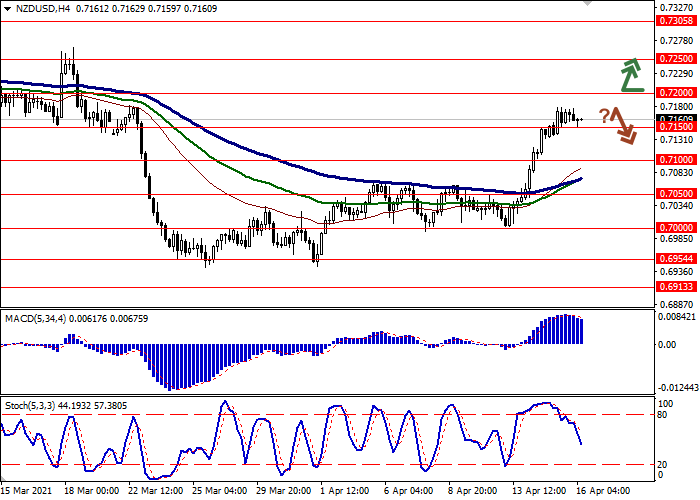
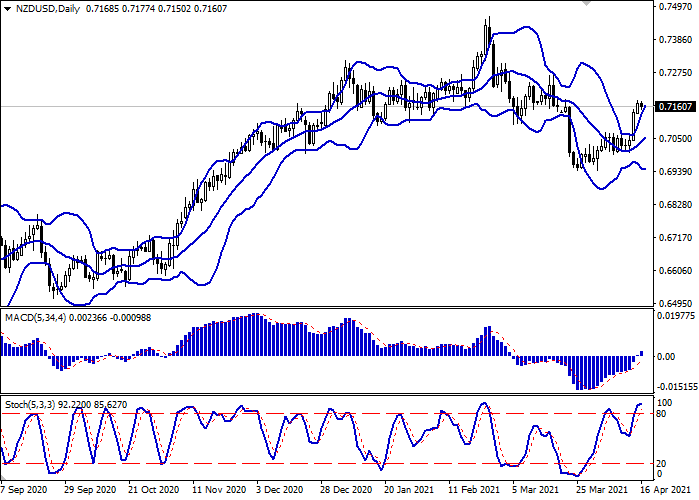
    NZD/USD: NZD loses "bullish" momentum

    Current trend

    NZD is showing ambiguous dynamics during today's Asian session, consolidating near its local highs since March 22. The instrument is under pressure from technical factors, as in the last three trading sessions NZD has shown strong growth.

    Some support for the pair on Friday was provided by upbeat macroeconomic data from New Zealand and China. Business NZ PMI in March soared from 53.4 to 63.6 points, which turned out to be much better than the negative forecasts of a decline to 51.3 points. China supported the positive sentiment in the market, showing GDP growth in Q1 2021 by an impressive 18.3% YoY after increasing by 6.5% YoY in the previous quarter. However, forecasts assumed an increase of 18.9% YoY. On a quarterly basis, the Chinese economy continues to slow down: in Q1 2021, GDP grew by only 0.6% QoQ, with the forecast of an increase of 1.5% QoQ.

    Support and resistance

    Bollinger Bands in D1 chart show stable growth. The price range is expanding but it fails to conform to the development of "bullish" sentiments at the moment. MACD indicator is growing keeping a strong buy signal (located above the signal line). Stochastic has reached its highs and currently indicates the risks of a corrective decline in the ultra-short term.

    Resistance levels: 0.7200, 0.7250, 0.7305.
    Support levels: 0.7150, 0.7100, 0.7050, 0.7000.


  9. #1249
    Senior Member MikhailLF's Avatar
    Join Date
    Sep 2017
    Posts
    830
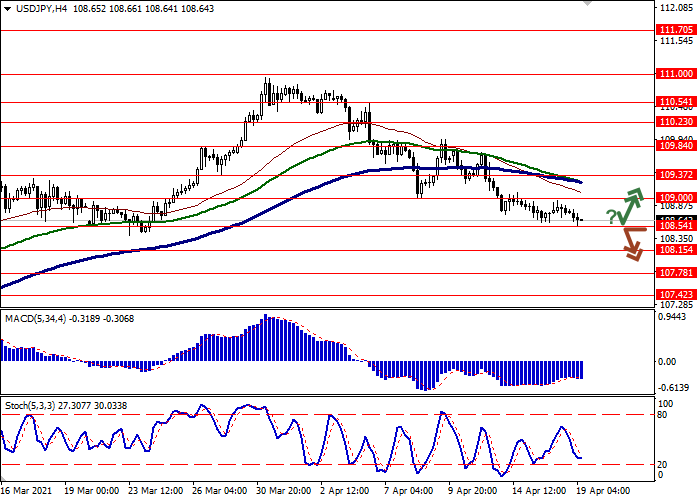
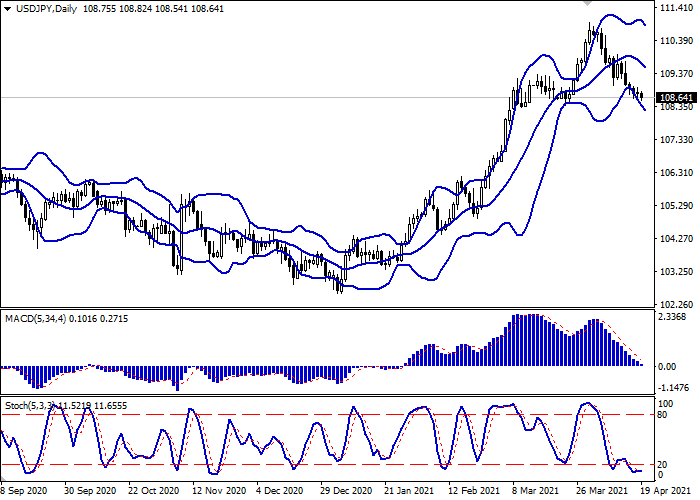
    USD/JPY: USD demonstrates downtrend

    Current trend

    USD is declining against JPY this morning session, developing a fairly strong "bearish" trend in the short term and renewing local lows since March 24. USD expects the emergence of new drivers in the market, but for now it remains under the pressure of the declining yields of Treasury bonds.

    In turn, JPY is getting some support after the release of macroeconomic statistics from Japan on Monday. Japanese Exports went up by 16.1% YoY in March after the decline by 4.5% YoY in the previous month. Analysts had expected growth by 11.6% YoY only. Imports for the same period rose by 5.7% YoY, which turned out to be better than projected by 1.0%, but noticeably weaker than the dynamics of the previous month at the level of 11.8% YoY. Merchandise Trade Balance Total in March increased from JPY 215.9B to JPY 663.7B. Analysts predicted trade balance at JPY 490B.

    Support and resistance

    Bollinger Bands in D1 chart demonstrate active decrease. The price range narrows slightly from above, but still remains spacious enough for the current level of market activity. MACD is going down preserving a stable sell signal (located below the signal line). The indicator is about to test the zero level for a breakdown. Stochastic, having reached the zero level, reversed into a horizontal plane, signaling the risks of oversold USD in the ultra-short term.

    Resistance levels: 109.00, 109.37, 109.84, 110.23.
    Support levels: 108.54, 108.15, 107.78, 107.42.


  10. #1250
    Senior Member MikhailLF's Avatar
    Join Date
    Sep 2017
    Posts
    830
    PayPal Holdings Inc.: wave analysis

    The price may grow.

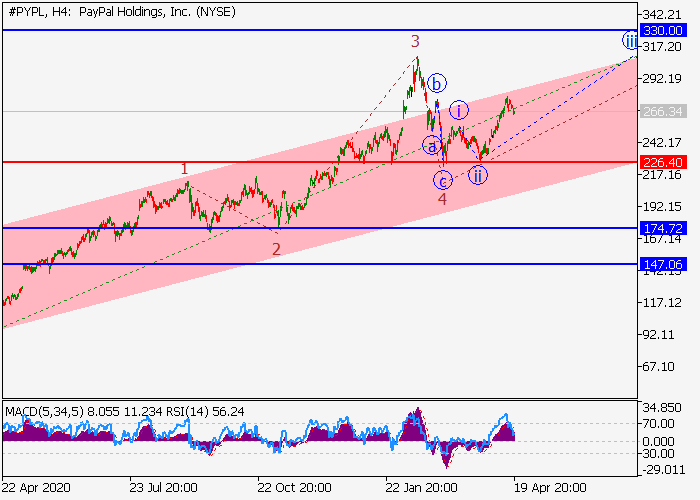
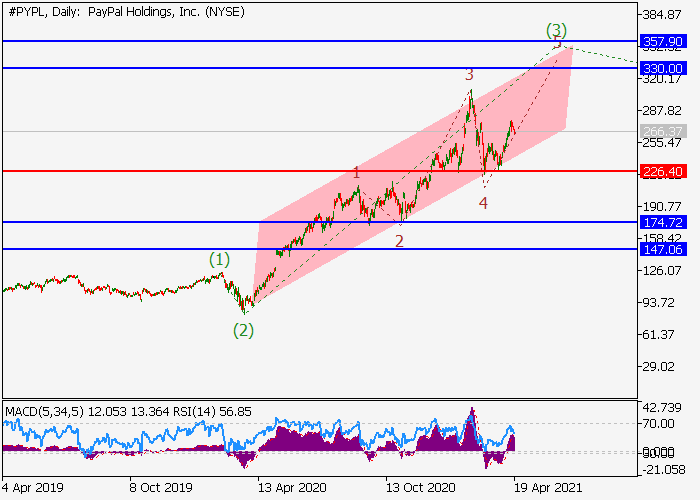
    On the daily chart, the third wave of the higher level (3) develops, within which the wave 3 of (3) formed. Now, a downward correction has developed as the wave 4 of (3), and the development of the wave 5 of (3) has started, within which the wave iii of 5 of the lower level is forming. If the assumption is correct, the price will grow to the levels of 330.00–357.90. In this scenario, critical stop loss level is 226.40.


Page 125 of 128 FirstFirst ... 25 75 115 123 124 125 126 127 ... LastLast

Tags for this Thread

Bookmarks

Posting Permissions

  • You may not post new threads
  • You may not post replies
  • You may not post attachments
  • You may not edit your posts
  •