Page 126 of 128 FirstFirst ... 26 76 116 124 125 126 127 128 LastLast
Results 1,251 to 1,260 of 1272
Like Tree3Likes

Forex News Analysis by LiteForex

This is a discussion on Forex News Analysis by LiteForex within the Analytics and News forums, part of the Trading Forum category; Brent Crude Oil: the instrument develops "bearish" momentum Current trend Brent crude oil prices are showing a slight decline, developing ...


  1. #1251
    Senior Member MikhailLF's Avatar
    Join Date
    Sep 2017
    Posts
    830
    Brent Crude Oil: the instrument develops "bearish" momentum

    Current trend

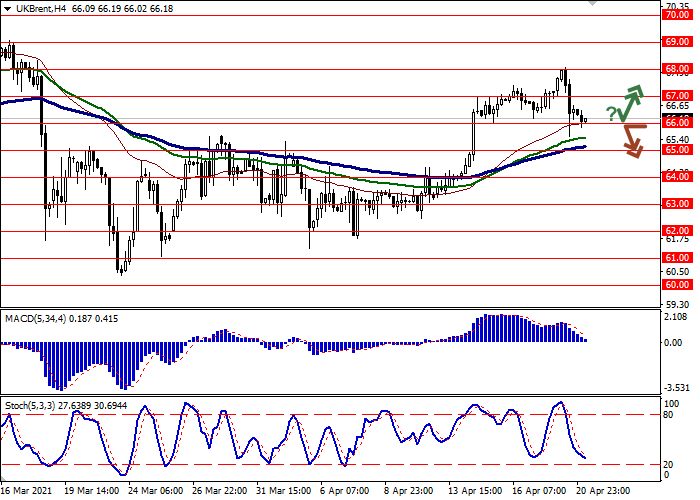
    Brent crude oil prices are showing a slight decline, developing the "bearish" momentum formed the day before and preparing to test 66.00 for a breakdown. The instrument's positions are under pressure from the alarming situation with the incidence of coronavirus in Asia, while interruptions in the supply of Libyan oil somewhat counterbalance the situation.

    The report of the American Petroleum Institute (API) on oil reserves released yesterday did not have a noticeable effect on the dynamics of the instrument. For the week ending April 16, published data showed a slight increase by 0.436M barrels after a decline of 3.608M barrels in the previous period.

    Today, investors are waiting for the statistics on crude oil stocks from the US EIA. Forecasts assume a further 2.86M barrels decline after a 5.889M barrels decline in the previous period.

    Support and resistance

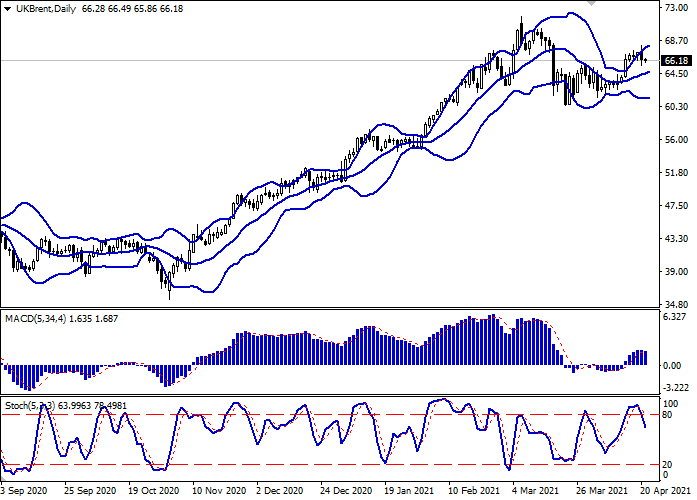
    Bollinger Bands in D1 chart show weak growth. The price range is slightly expanded from above, remaining spacious enough for the current activity level in the market. MACD reversed downwards having formed a weak sell signal (located below the signal line). Stochastic is showing similar dynamics, retreating from its highs, indicating the overbought instrument in the ultra-short term.

    Current indicators do not contradict the further development of the "bearish" trend in the ultra-short term.

    Resistance levels: 67.00, 68.00, 69.00, 70.00.
    Support levels: 66.00, 65.00, 64.00, 63.00.


  2. #1252
    Senior Member MikhailLF's Avatar
    Join Date
    Sep 2017
    Posts
    830
    American Express Co.: wave analysis

    The price may grow.

    On the daily chart, the fifth wave of the higher level (5) develops, within which the wave 3 of (5) forms. Now, the fifth wave of the lower level v of 3 is developing. If the assumption is correct, the price will grow to the levels of 160.00–170.00. In this scenario, critical stop loss level is 134.73.


  3. #1253
    Senior Member MikhailLF's Avatar
    Join Date
    Sep 2017
    Posts
    830
    GBP/USD: the instrument shows uncertain growth

    Current trend

    GBP demonstrates weak growth in trading this morning session, recovering from the active decline the day before, which was caused by the emergence of positive macroeconomic statistics from the US, as well as the continuing long-term profit-taking by investors.

    Markets were positively greeted by data on a decrease in the number of initial jobless claims for the week ending April 16 from 586K to 547K, which turned out to be much better than the negative forecast of growth to 617K. The number of continuing jobless claims fell from 3.708M to 3.674M, but the market was counting on a slightly larger decline to 3.667M.

    Today, GBP is in anticipation of the publication of statistics on the UK Markit PMIs in the manufacturing and services sector for April.

    Support and resistance

    Bollinger Bands in D1 chart demonstrate flat dynamics. The price range is almost unchanged, but it remains rather spacious for the current level of activity in the market. MACD reversed downwards having formed a weak sell signal (located below the signal line). Stochastic shows a somewhat more confident decline, signaling the prospects for a downtrend in the nearest future.

    Existing short positions should be kept until technical indicators are clarified.

    Resistance levels: 1.3900, 1.3960, 1.4000.
    Support levels: 1.3822, 1.3800, 1.3750, 1.3700.


  4. #1254
    Senior Member MikhailLF's Avatar
    Join Date
    Sep 2017
    Posts
    830
    EUR/USD: updating February highs

    Current trend

    EUR is showing moderate gains against USD during today's Asian session, continuing its Friday rally and renewing local highs since February 26.

    A noticeable support for EUR at the end of the last trading week was provided by the optimistic macroeconomic statistics from the eurozone. Markit Manufacturing PMI in April rose from 62.5 to 63.3 points with a forecast of a decline to 62 points. Composite PMI for the same period rose from 53.2 to 53.7 points, which also turned out to be better than expectations at 52.8 points. For the first time in a long time, Services PMI managed to consolidate above the psychological level of 50 points: in April, the indicator rose from 49.6 to 50.3 points, contrary to forecasts of a fall to 49.1 points.

    Today, investors are focused on the publication of data from the IFO on the level of business optimism in Germany in April. In addition, during the day, the markets expect speeches by representatives of the European Central Bank Fabio Panetta and Philip Lane.

    Support and resistance

    Bollinger Bands in D1 chart show stable growth. The price range expands slightly, freeing a path to new local highs for the "bulls". MACD indicator is growing preserving a stable buy signal (located above the signal line). Stochastic, after a short decline, reverses upwards, signaling strongly overbought EUR in the ultra-short term.

    Resistance levels: 1.2150, 1.2200, 1.2234, 1.2271.
    Support levels: 1.2078, 1.2000, 1.1950, 1.1900.


  5. #1255
    Senior Member MikhailLF's Avatar
    Join Date
    Sep 2017
    Posts
    830
    Nvidia Corp.: wave analysis

    The price may grow.

    On the daily chart, the upward third wave of the higher level (3) develops, within which the wave 3 of (3) formed. Now, a local correction has developed as the fourth wave 4 of (3), and the formation of the wave 5 of (3) has started, within which the first wave of the lower level i of 5 is developing. If the assumption is correct, the price will grow to the levels of 700.00–750.00. In this scenario, critical stop loss level is 547.76.


  6. #1256
    Senior Member MikhailLF's Avatar
    Join Date
    Sep 2017
    Posts
    830
    Mastercard Inc.: wave analysis

    The price may grow.

    On the daily chart, the fifth wave of the higher level (5) develops, within which the wave 1 of (5) formed, and a local correction developed as the second wave 2 of (5). Now, the third wave 3 of (5) is forming, within which the wave of the lower level iii of 3 is developing. If the assumption is correct, the price will grow to the levels of 450.00–500.00. In this scenario, critical stop loss level is 355.08.


  7. #1257
    Senior Member MikhailLF's Avatar
    Join Date
    Sep 2017
    Posts
    830
    Alibaba Group Holdings Ltd.: wave analysis

    The price may grow.

    On the daily chart, the upward fifth wave of the higher level (5) develops, within which a downward correction ended as the fourth wave 4 of (5). Now, the development of the fifth wave of the lower level 5 of (5) has started, within which the wave i of 5 has formed, a local correction has developed as the wave ii of 5, and the formation of the wave iii of 5 has started. If the assumption is correct, the price will grow to the levels of 299.84–318.84. In this scenario, critical stop loss level is 220.97.


  8. #1258
    Senior Member MikhailLF's Avatar
    Join Date
    Sep 2017
    Posts
    830
    Microsoft Corp.: wave analysis

    The price is in a correction and may grow.

    On the daily chart, the fifth wave of the higher level (5) of 3 develops, within which the wave 3 of (5) forms. Now, the third wave of the lower level iii of 3 has developed, and a local correction is forming as the fourth wave iv of 3. If the assumption is correct, the price will grow to the levels of 285.00–300.00. In this scenario, critical stop loss level is 231.09.


  9. #1259
    Senior Member MikhailLF's Avatar
    Join Date
    Sep 2017
    Posts
    830
    Bank of America Corp.: wave analysis

    The price may grow.

    On the daily chart, the third wave of the higher level (3) forms, within which the wave 3 of (3) developed. Now, a local correction has formed as the fourth wave 4 of (3), and the development of the wave 5 of (3) has started. If the assumption is correct, the price will grow to the levels of 44.50–47.00. In this scenario, critical stop loss level is 37.66.


  10. #1260
    Senior Member MikhailLF's Avatar
    Join Date
    Sep 2017
    Posts
    830
    EUR/USD: EUR quotes remain under pressure

    Current trend

    EUR shows a slight increase against USD during today's Asian session, correcting after yesterday's decline, which led to the renewal of local lows of April 22.

    USD retains its previous growth momentum, which was formed at the end of last week, receiving additional support after the speech of the US Treasury Secretary Janet Yellen, who did not rule out the possibility of an early rate hike in order to avoid overheating the American economy, which is demonstrating impressive growth rates. Investors are also optimistic about news of the gradual reopening of the US states against the backdrop of an active vaccination campaign and a general stabilization of the epidemiological situation.

    Market participants are focused on statistics on business activity in the services and manufacturing sectors of the eurozone from Markit. In addition, a speech by the European Central Bank representative Philip Lane is expected, who may hint on tightening monetary policy in the region.

    Support and resistance

    In the D1 chart, Bollinger Bands are reversing horizontally. The price range is narrowing, reflecting the emergence of ambiguous dynamics of trading in the short term. MACD is going down preserving a stable sell signal (located below the signal line). Stochastic, having approached its lows, is trying to reverse upwards, indicating the risks of oversold EUR in the ultra-short term.

    To open new positions, it is necessary to wait for the trade signals to become clear.

    Resistance levels: 1.2037, 1.2087, 1.2148, 1.2200.
    Support levels: 1.2000, 1.1945, 1.1900, 1.1850.


Tags for this Thread

Bookmarks

Posting Permissions

  • You may not post new threads
  • You may not post replies
  • You may not post attachments
  • You may not edit your posts
  •