Page 127 of 128 FirstFirst ... 27 77 117 125 126 127 128 LastLast
Results 1,261 to 1,270 of 1272
Like Tree3Likes

Forex News Analysis by LiteForex

This is a discussion on Forex News Analysis by LiteForex within the Analytics and News forums, part of the Trading Forum category; WTI Crude Oil: a sharp drop in crude stocks supported prices Current trend The price of North American light oil, ...


  1. #1261
    Senior Member MikhailLF's Avatar
    Join Date
    Sep 2017
    Posts
    830
    WTI Crude Oil: a sharp drop in crude stocks supported prices

    Current trend

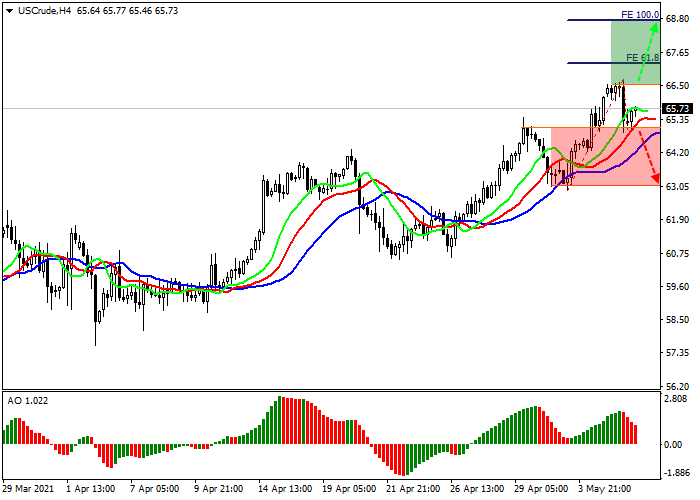
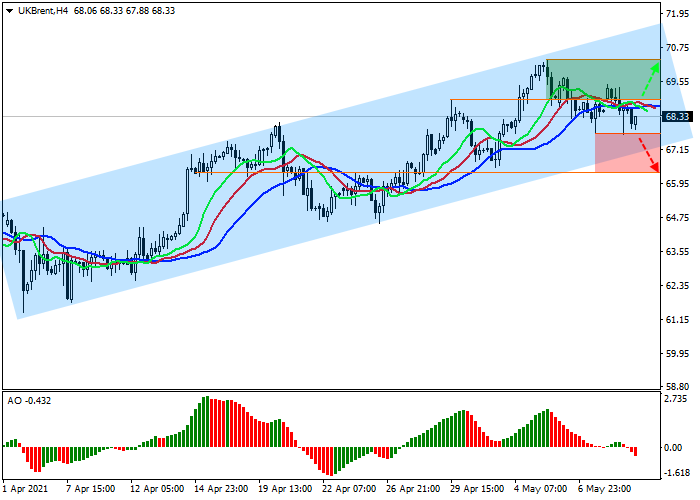
    The price of North American light oil, WTI Crude Oil, moves within a corrective uptrend, trading at the level of 65.73.

    The quotes received significant support after the American Petroleum Institute (API) and the Energy Information Administration (EIA) published their reports on reserves this week. According to API data, inventories in storage facilities decreased by 7.688M barrels, which is significantly higher than the expected decrease by 2.191M. A day later, the EIA reported a drop in inventories of American firms by 7.990M barrels, which is significantly higher than the expected 2.346M. for a week, could not but provoke the growth of the instrument. The upward dynamics may continue until the end of the week.

    Support and resistance

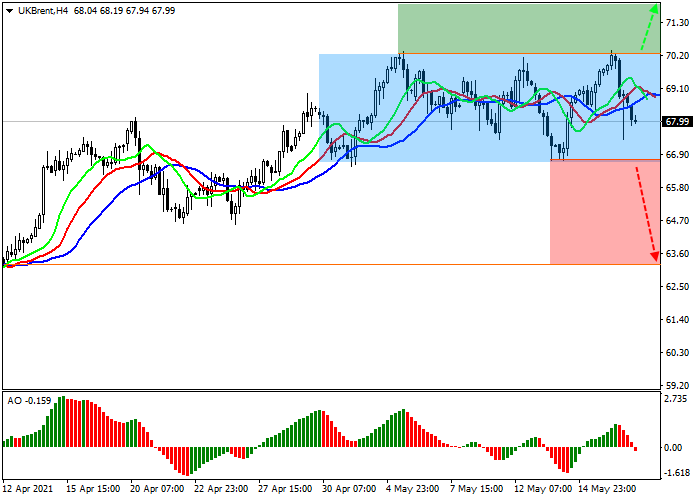
    On the local chart, the price continues its corrective growth, trading above the key level of $65. Technical indicators are in the state of a buy signal, completing a local correction: the fluctuation range of the Alligator EMA is ready for a new extension, and the AO oscillator histogram is in the buy zone, although it is still forming downwards bars.

    Resistance levels: 66.50, 68.70.

    Support levels: 65.00, 63.00.

  2. #1262
    Senior Member MikhailLF's Avatar
    Join Date
    Sep 2017
    Posts
    830
    XAU/USD: wave analysis

    The pair may grow.

    On the daily chart, the third wave of the higher level (3) formed, a downward correction developed as the fourth wave (4), and the formation of the fifth wave (5) started. Now, the first wave of the lower level 1 of (5) is developing, within which the correctional wave iv of 1 has formed, and the wave v of 1 is developing. If the assumption is correct, the pair will grow to the levels of 1841.90–1877.85. In this scenario, critical stop loss level is 1768.71.


  3. #1263
    Senior Member MikhailLF's Avatar
    Join Date
    Sep 2017
    Posts
    830
    USD/CAD: the likelihood of a trend change is still low

    Current trend

    The USD/CAD pair is showing a downtrend, trading at 1.2115.

    CAD continues to look strong against the backdrop of the declining USD; however, Friday's labor market data from Canada made analysts question the strength of CAD. The Unemployment Rate in April rose from 7.5% to 8.1%, showing the most significant deterioration since March 2020. The Net Change in Employment decreased by 207.1K, which turned out to be much worse than the expected decline by 175.0K. Participation Rate fell to 64.9% from 65.2%.

    The USD/CAD pair did not change the trend only due to the fact that the situation on the US labor market turned out to be even worse. The Unemployment Rate in April rose from 6.0% to 6.1%. In turn, the employment rate fell in almost all sectors. The number of jobs in the manufacturing industry decreased by 18K, with a projected increase of 55K, and the number of Nonfarm Payrolls increased by 266K, with an expected increase of 978K. Thus, the target indicators for employment were again not reached, so raising interest rates by the US Fed is out of the question.

    Support and resistance

    On the daily chart, the price continues to form a global descending channel. Technical indicators are in a state of sale: the range of EMA fluctuations on the Alligator indicator continues to expand, and the histogram of the AO oscillator is trading in the sales zone.

    Resistance levels: 1.2260, 1.2610.
    Support levels: 1.2050, 1.1800.


  4. #1264
    Senior Member MikhailLF's Avatar
    Join Date
    Sep 2017
    Posts
    830
    Brent Crude Oil: awaiting the publication of monthly OPEC report

    Current trend

    The prices for benchmark Brent crude oil continue their correctional movement, trading around $68.30 per barrel. The quotes stopped their global growth and consolidated within a comfortable range.

    Investors are monitoring the situation in Asia, where a new outbreak of the coronavirus pandemic has been recorded. It is still unknown to what extent this situation may affect demand. OPEC is to publish its monthly report today and the situation may become clearer. Also, the US Department of Energy will present its short-term outlook on the energy market, and traders will be able to assess the impact of recent cyberattacks on the US fuel infrastructure.

    As for the situation in the global arbitrage position of the spread between Brent Crude Oil and WTI Crude Oil, then everything is quite calm, and the price difference has been kept in the range of $3.5–4 for a long time, which indicates the reluctance of large players to do something. Global investors are satisfied with the current quotes of the asset and the stable range of weekly volatility of 4–6%.

    Support and resistance

    Locally, the asset is growing smoothly within a fairly wide channel. Technical indicators are in a state of uncertainty: fast EMAs of the Alligator indicator intertwined with the signal line and the histogram of the AO oscillator trades close to the transition level.

    Resistance levels: 68.90, 70.30.
    Support levels: 67.70, 66.30.


  5. #1265
    Senior Member MikhailLF's Avatar
    Join Date
    Sep 2017
    Posts
    830
    Mastercard Inc.: wave analysis

    The price may grow.

    On the daily chart, the fifth wave of the higher level (5) develops, within which the wave 3 of (5) forms. Now, the first wave of the lower level i of 3 has developed, and a local correction is forming as the wave ii of 3. If the assumption is correct, after the end of the correction, the price will grow to the levels of 450.00–500.00. In this scenario, critical stop loss level is 313.00.


  6. #1266
    Senior Member MikhailLF's Avatar
    Join Date
    Sep 2017
    Posts
    830
    XAG/USD: high bond yields inhibit growth

    Current trend

    Silver contract price is correcting downwards, trading at 27.00 and continuing to trade in a global uptrend.

    Investors watched the auction for the placement of 10-year US Treasuries at a rate of 1.684%. Such high yield has a negative effect on the price of silver and gold, but it could not exceed the psychological level of 1.700%, which gives hope for a slowdown in the growth of the debt market.

    The XAG/USD pair is supported by a significant increase in inflation in the US, the expectation of which was one of the main reasons for the strengthening of precious metals in April and May. These assets have always been ideal hedging instruments to protect capital from inflationary risks, so higher rates from the US Fed are needed for their growth. Annual inflation in the country accelerated to 2.6%, which means an increased likelihood of an early change in monetary policy by the American regulator.

    Support and resistance

    On the global chart of the asset, the price continues to grow within a narrow ascending channel. Technical indicators maintain the buy signal: the range of EMA fluctuations on the Alligator indicator continues to expand, and the histogram of the AO oscillator is high in the purchase zone.

    Resistance levels: 27.61, 29.00.
    Support levels: 26.47, 24.93.


  7. #1267
    Senior Member MikhailLF's Avatar
    Join Date
    Sep 2017
    Posts
    830
    Altria Group Inc.: wave analysis

    The price may grow.

    On the daily chart, the first wave of the higher level (1) develops, within which the wave 3 of (1) forms. Now, the third wave of the lower level iii of 3 has formed, and a local correction has ended as the fourth wave iv of 3. If the assumption is correct, the price will grow within the wave v of 3 to the levels of 55.00–57.50. In this scenario, critical stop loss level is 44.71.


  8. #1268
    Senior Member MikhailLF's Avatar
    Join Date
    Sep 2017
    Posts
    830
    XAU/USD: growth in supply pushes quotes up

    Current trend

    Gold quotes continue corrective growth, trading at $1,855 per ounce. After the lifting of quarantine restrictions, the global demand for metals went up sharply, provoking price growth.

    At the moment, industry leaders are beginning to actively recover from the consequences of the pandemic, increasing gold production, which will undoubtedly affect the price of the precious metal. Yesterday, the South African statistics service published data on mining for March this year. According to official data, the figure rose by 21.3%, the growth of platinum ore production was 68.6%, and of gold – 10.5%. However, the volume of sales of the asset rose much higher, at 61.3%.

    Thus, the strengthening of world metal production and the current negative trend in the US dollar contribute to the positive dynamics of the instrument.

    Support and resistance

    On the global chart, the price reaches the resistance line of the global downtrend and its breakout will allow the rate to reach 2000.0 by the end of May. Technical indicators keep a global buy signal: the fluctuation range of the Alligator EMA is quite wide, and the histogram of the AO oscillator is trading in the positive zone.

    Resistance levels: 1871.0, 1955.0.
    Support levels: 1815.0, 1763.0.


  9. #1269
    Senior Member MikhailLF's Avatar
    Join Date
    Sep 2017
    Posts
    830
    EUR/USD: investors await signals from the FOMC

    Current trend

    The EUR/USD pair grows, trading around the level if ​​1.2169 in anticipation of the publication of data on the Q1 EU GDP.

    Although the pace of vaccination in the EU countries has accelerated significantly, the economy continues to recover extremely slowly. Analysts expect the indicator to remain unchanged at –1.8% YoY and –0.6% QoQ. Italian consumer prices were released yesterday, rising by 0.4% for April, slightly above 0.3% for March. The harmonized consumer price index for the same period slowed down to 0.9% from 1.8% for March.

    USD is trading at rather low volumes in anticipation of the publication of the minutes of the Federal Open Market Committee (FOMC), which will take place tomorrow. Despite the numerous statements by experts that the US Federal Reserve does not need to raise interest rates right now, it has happened more than once that the regulator acted unexpectedly. Investors prefer to wait for hints from the department and are in no hurry to open positions with the American currency.

    Support and resistance

    Locally, the price continues its corrective growth. Technical indicators keep a buy signal: the fluctuation range of the EMA on the Alligator indicator is wide enough, and the histogram of the AO oscillator moves in the buy zone, forming new upward bars.

    Resistance levels: 1.2182, 1.2260.
    Support levels: 1.2141, 1.2060.


  10. #1270
    Senior Member MikhailLF's Avatar
    Join Date
    Sep 2017
    Posts
    830
    Brent Crude Oil: pending decisions on the Iranian nuclear deal

    Current trend

    Brent crude prices continue their correctional movement, trading at 68.00 after another attempt to consolidate above the key level of 70.00.

    Analysts point to possible significant progress in negotiations between the United States and Iran on the renewal of the nuclear deal. If the parties are able to agree, and the US authorities will not extend the sanctions against Tehran, this will allow Iran to significantly increase the supply of cheap "black gold" to the world market.

    Yesterday, the American Petroleum Institute (API) released data on weekly stocks, which increased by 0.620M barrels, which is lower than the expected increase of 1.680M. Today, the Energy Information Administration (EIA) of the US Department of Energy will publish its report, which is predicted to show an increase in reserves of 1.623M barrels. However, if the actual data demonstrate a decrease in the indicator, the local trend in the asset may again change to an uptrend.

    Support and resistance

    On the local chart, the asset continues to trade close to the global high, forming a sideways channel with the boundaries of 70.00–66.50.

    Technical indicators are in a state of uncertainty: the fast EMAs of the Alligator indicator are below the signal line, and the histogram of the AO oscillator has moved into the sell zone, forming the first bar below the zero level.

    Resistance levels: 70.20, 74.00.
    Support levels: 66.70, 63.00.


Page 127 of 128 FirstFirst ... 27 77 117 125 126 127 128 LastLast

Tags for this Thread

Bookmarks

Posting Permissions

  • You may not post new threads
  • You may not post replies
  • You may not post attachments
  • You may not edit your posts
  •