Page 117 of 128 FirstFirst ... 17 67 107 115 116 117 118 119 127 ... LastLast
Results 1,161 to 1,170 of 1272
Like Tree3Likes

Forex News Analysis by LiteForex

This is a discussion on Forex News Analysis by LiteForex within the Analytics and News forums, part of the Trading Forum category; Morning Market Review EUR/USD EUR shows flat dynamics of trading against USD during today's Asian session, consolidating after an active ...


  1. #1161
    Senior Member MikhailLF's Avatar
    Join Date
    Sep 2017
    Posts
    830
    Morning Market Review

    EUR/USD

    EUR shows flat dynamics of trading against USD during today's Asian session, consolidating after an active decline of the instrument last Friday. EUR ended the session on December 4 in the red, responding to technical factors, while USD remained under pressure after the publication of weak data on employment in the country. The November labor market report reflected an increase in Nonfarm Payrolls by only 245K after an increase of 610K in October. Investors expected a slowdown in the dynamics of the indicator, but hoped for 469K new jobs. At the same time, the Unemployment Rate fell from 6.9% to 6.7%, and Average Hourly Earnings in November increased from +0.1% MoM to +0.3% MoM, which also turned out to be better than the neutral market forecasts. Today, traders expect publication of data on industrial production in Germany for October. Interesting statistics from the US will appear only on Thursday, and before that investors will actively discuss the prospects for further easing of monetary policy from the Fed in the light of the published report on the US labor market.

    GBP/USD

    GBP is showing ambiguous trading dynamics against USD in today's Asian session, consolidating near 1.3400. The instrument managed to update record highs since May 2018 last week; however, GBP failed to consolidate at new levels, since the technical factors of the correction were very strong. The trading of the new week starts quite carefully. Some support for GBP is provided by weak data from the US, which appeared at the end of last week, but there are still few fundamental growth factors. It became known on Saturday that the UK and the EU again failed to agree on a trade agreement within the framework of the Brexit transition period, and therefore the negotiators will continue joint meetings this week. Meanwhile, British Prime Minister Boris Johnson and the European Commission President Ursula von der Leyen announced significant progress in the negotiations; however, the market got used to these statements.

    NZD/USD

    NZD is trading ambiguously against USD in today's Asian session, preparing to test the level of 0.7000 for a breakdown again. The instrument showed an active decline last Friday, retreating from the record highs, updated the day before. The reason for the development of the "bearish" trend were technical factors, while the long-awaited report on the US labor market, released last Friday, disappointed investors with a slowdown in the growth of Nonfarm Payrolls (+245K against +610K in October). The Chinese statistics provide moderate support to the instrument today. China's Exports in November showed an impressive 21.1% YoY growth after rising only by 11.4% YoY in October. Forecasts suggested an increase of 12% YoY only. Imports over the same period, on the contrary, slowed down from +4.7% YoY to +4.5% YoY, which led to a noticeable increase in the trade surplus from USD 58.44B to 75.42B, which is significantly ahead of forecasts investors at USD 53.5B.

    USD/JPY

    USD is trading with a downtrend against JPY during today's Asian session, leveling the growth of the instrument last Friday, when the "bulls" still managed to recover, despite the publication of not very successful macroeconomic statistics from the US. At the beginning of the week, investors are returning to strategies that are still characterized by high demand for "safe" assets, given the tense epidemiological situation in the world. Japanese investors expect the publication of statistics from Japan tomorrow. Among other things, traders will be interested in the updated data on the dynamics of Japan's GDP for Q3 2020. In addition, Japan will release the dynamics of changes in Labor Cash Earnings and Household Spending for October.

    XAU/USD

    Gold prices are consolidating in today's Asian session, being located near the level of 1840.00 and local highs since November 23, updated at the end of the last trading week. Technical factors contributed to the decline in the instrument last Friday, while fundamentally USD remains under pressure after the publication of an uncertain report on the US labor market for November and in anticipation of new support measures for the American economy. In turn, the optimistic news regarding the development of vaccines against the coronavirus makes traders keep some of the risky positions, and the stock market is kept near record highs. Since December 7, Great Britain is one of the first in the world to begin a large-scale vaccination of the population (starting with risk groups) with a vaccine from Pfizer and BioNTech.

  2. #1162
    Senior Member MikhailLF's Avatar
    Join Date
    Sep 2017
    Posts
    830
    EUR/USD: wave analysis

    The pair may grow.

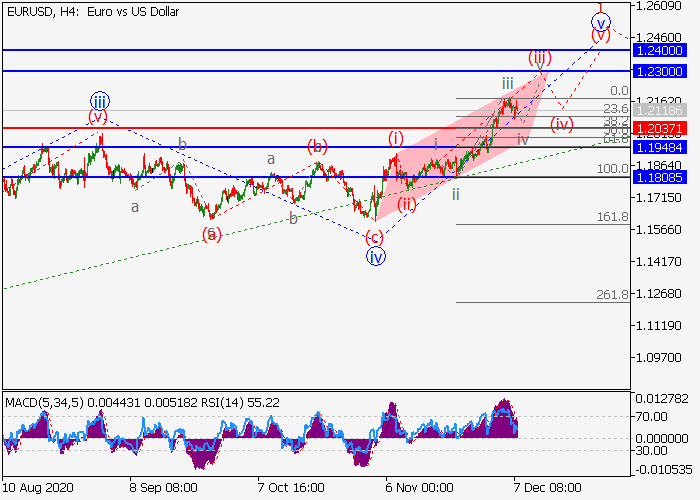
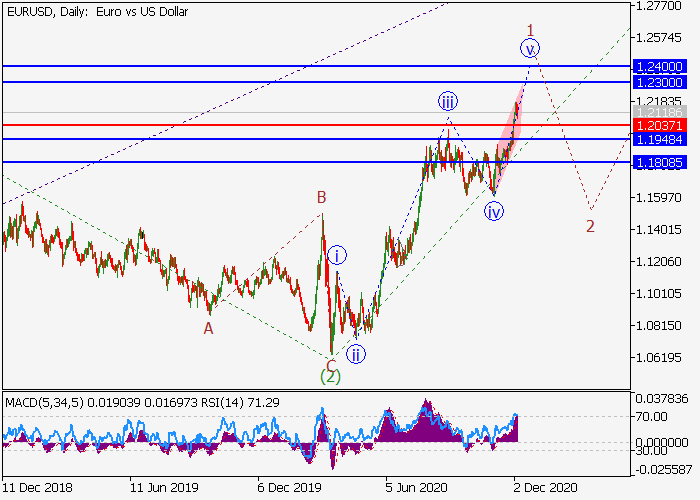
    On the daily chart, the first wave of the higher level 1 of (3) develops, within which the wave v of 1 forms. Now, the third wave of the lower level (iii) of v is developing, within which the wave iii of (iii) is forming, and the local correction iv of (iii) is ending. If the assumption is correct, the pair will grow to the levels of 1.2300–1.2400. In this scenario, critical stop loss level is 1.2037.


  3. #1163
    Senior Member MikhailLF's Avatar
    Join Date
    Sep 2017
    Posts
    830
    USD/CAD: wave analysis

    The pair may fall.

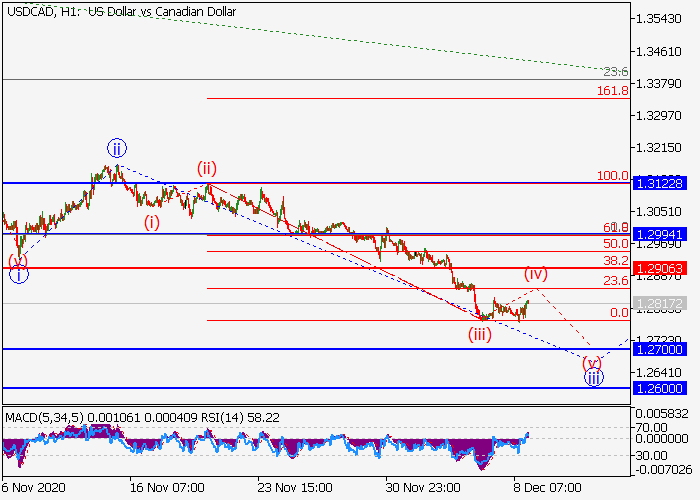
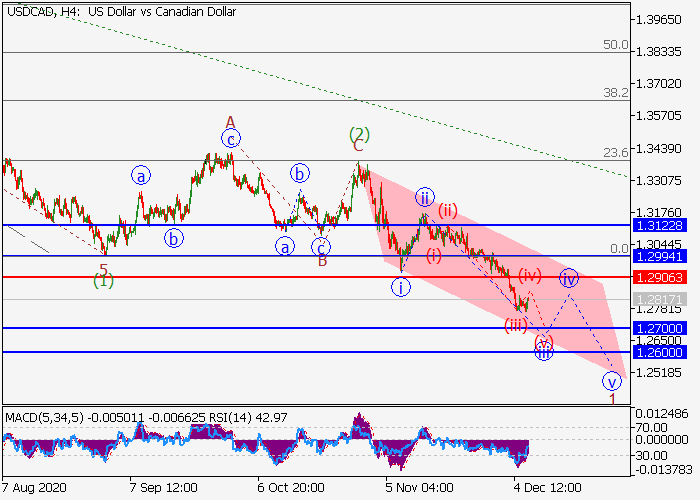
    On the 4-hour chart, a correction of the higher level developed as the wave (2), and the formation of the downward wave (3) started. Now, the third wave of the lower level iii of 1 is developing, within which the wave (iii) of iii has formed, and the local correction (iv) of iii is developing. If the assumption is correct, after the end of the correction, the pair will fall to the levels of 1.2700–1.2600. In this scenario, critical stop loss level is 1.2906.


  4. #1164
    Senior Member MikhailLF's Avatar
    Join Date
    Sep 2017
    Posts
    830
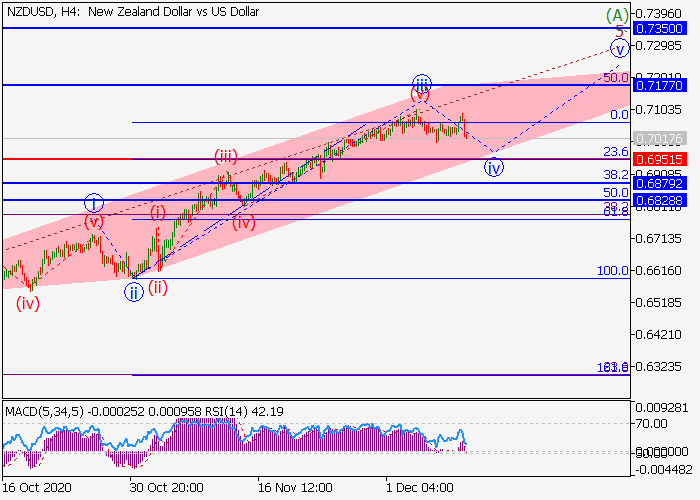
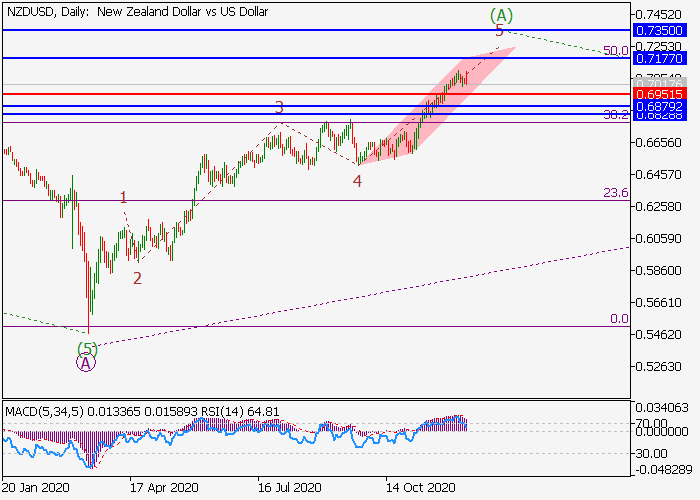
    NZD/USD: wave analysis

    The pair is in a correction and may grow.

    On the daily chart, the upward wave (А) of B develops as a momentum, within which the wave 5 of (A) forms. Now, the third wave of the lower level iii of 5 has formed, and a local correction is developing as the fourth wave iv of 5. If the assumption is correct, after the end of the correction, the pair will grow to the levels of 0.7177–0.7350. In this scenario, critical stop loss level is 0.6951.


  5. #1165
    Senior Member MikhailLF's Avatar
    Join Date
    Sep 2017
    Posts
    830
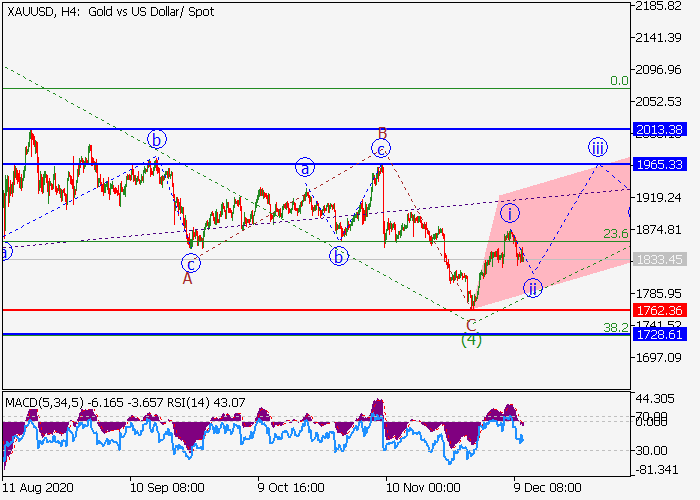
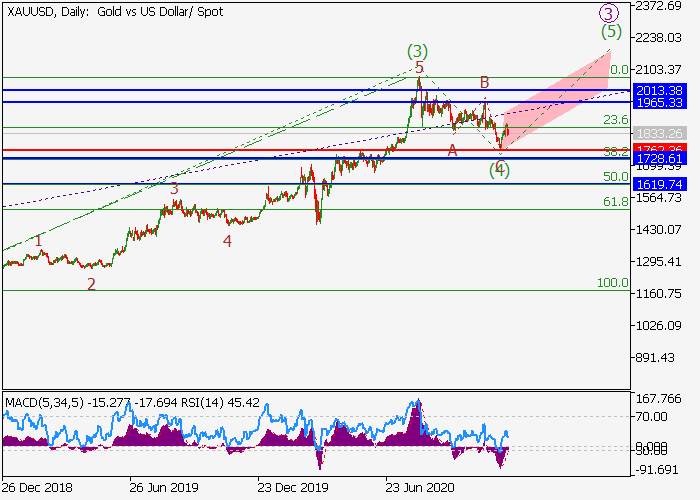
    The pair may grow.

    On the daily chart, the third wave of the higher level (3) formed, and a downward correction formed as the wave (4). Now, the development of the fifth wave (5) has started, within which the first entry wave of the lower level i of 1 of (5) has formed, and the wave ii of 1 is ending. If the assumption is correct, the pair will grow to the levels of 1965.33–2013.38. In this scenario, critical stop loss level is 1762.36.


  6. #1166
    Senior Member MikhailLF's Avatar
    Join Date
    Sep 2017
    Posts
    830
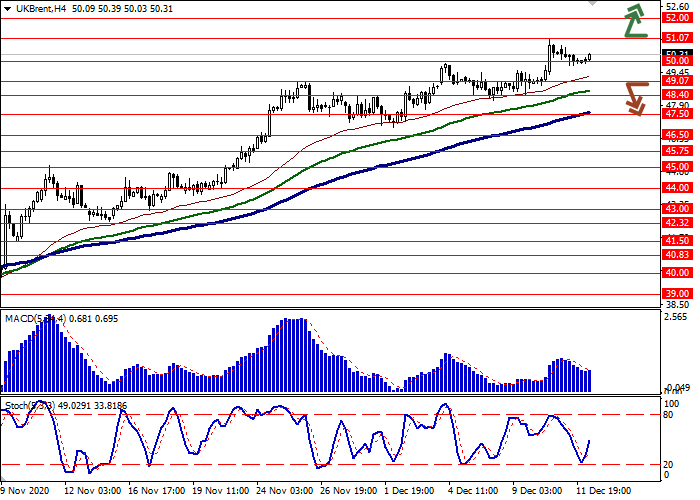
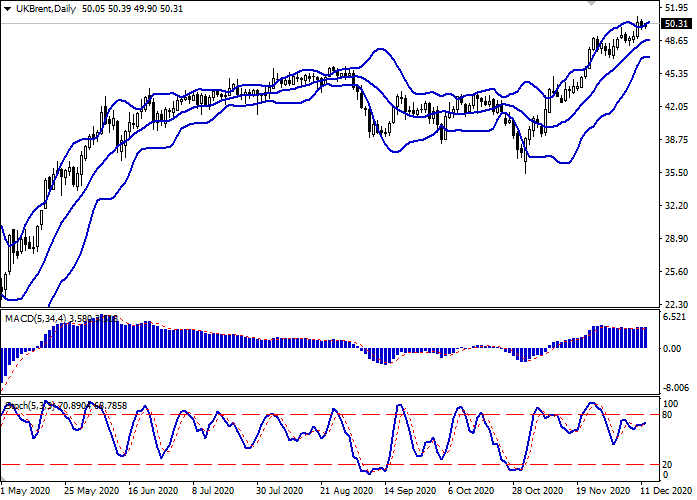
    Brent Crude Oil: prices are recovering

    Current trend

    Today, during the Asian session, oil prices are showing upward dynamics, trying to consolidate above the psychological level of $50 per barrel. The instrument dropped slightly at the end of the last trading week, however, it was caused by technical factors.

    The quotes are strongly supported by optimism regarding vaccines against COVID-19. Last weekend, it became known that the US Food and Drug Administration (FDA) noted the advantage of the vaccine from Pfizer and approved its use for the population over 16 years old. A vaccination campaign is expected to start soon in the US, which will strengthen the market's confidence that the next year can be survived without new lockdowns.

    Meanwhile, Baker Hughes' report on active oil platforms in the US, released on Friday, again reflected a solid increase from 246 to 258 units.

    Support and resistance

    On the daily chart, Bollinger Bands reverse into a horizontal plane. The price range is expanding from above but not as fast as the “bullish” dynamics develop. The MACD indicator is growing, maintaining a poor buy signal (the histogram is above the signal line). Stochastic, without reaching the overbought area, reversed into a horizontal plane near the level of 80, indicating the ambiguous nature of the last days' trading.

    The current readings of technical indicators do not contradict the further development of upward dynamics.

    Resistance levels: 51.07, 52.00, 53.00.

    Support levels: 50.00, 49.07, 48.40, 47.50.


  7. #1167
    Senior Member MikhailLF's Avatar
    Join Date
    Sep 2017
    Posts
    830
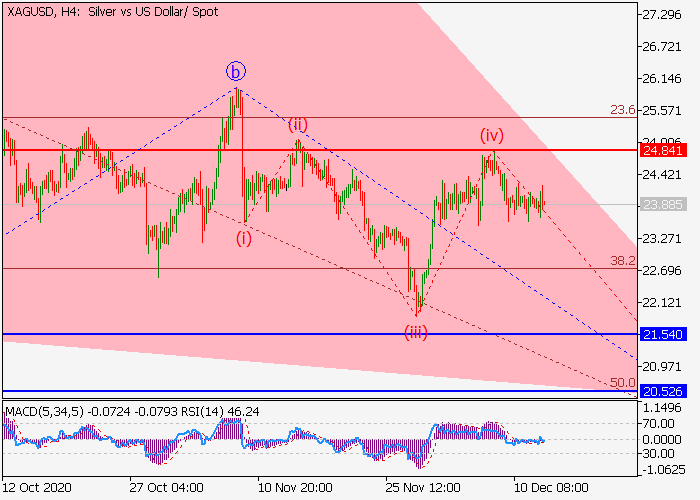
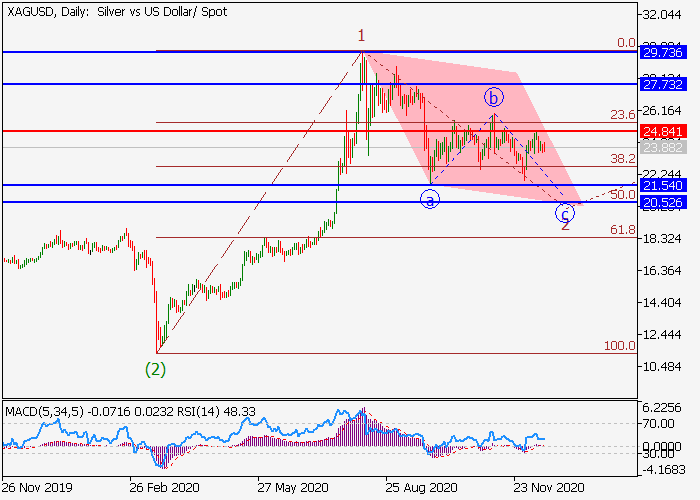
    XAG/USD: wave analysis

    The pair may fall.

    On the daily chart, the first wave of the higher level 1 of (3) formed, and a downward correction develops as the wave 2 of (3). Now, the wave c of 2 is forming, within which a local correction has ended as the fourth wave of the lower level (iv) of c, and the development of the wave (v) of c has started. If the assumption is correct, the price will fall to the levels of 21.54–20.52. In this scenario, critical stop loss level is 24.84.


  8. #1168
    Senior Member MikhailLF's Avatar
    Join Date
    Sep 2017
    Posts
    830
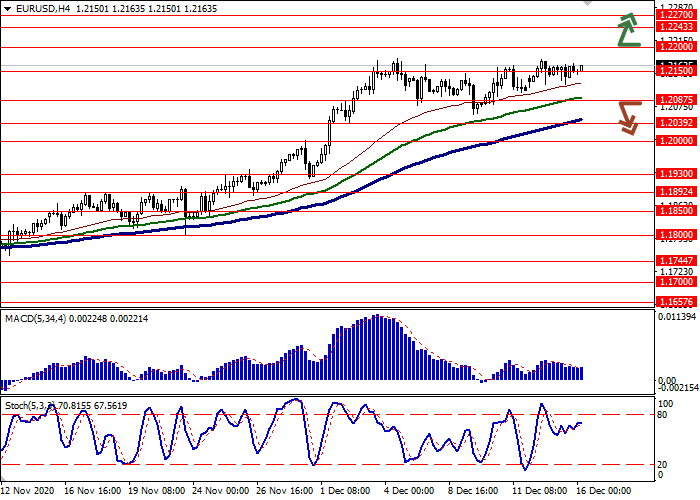
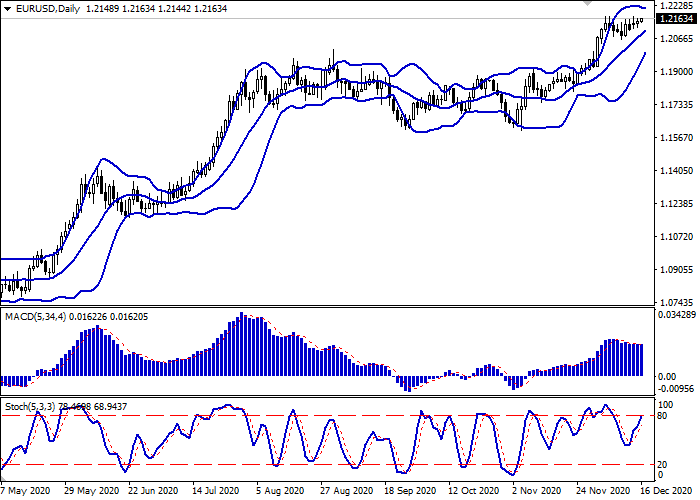
    EUR/USD: euro is near record highs

    Current trend

    Today during the Asian session, the EUR/USD pair is growing slightly, gradually returning to the previous record highs around 1.2174.

    USD weakens amid optimism about COVID-19 vaccinations, actively starting around the world. The process may begin in the US soon, as the Food and Drug Administration (FDA) recently approved the use of Pfizer and BioNTech vaccines. Yesterday, it became known that the FDA is preparing to publish the results of the third phase of clinical trials of the vaccine from Moderna, which can also be interpreted as the first step towards its approval for emergency use in the country. Meanwhile, the epidemiological situation in the US remains difficult. Earlier, the mayor of New York expressed the idea of ​​returning the city to a full-fledged quarantine in response to a sharp increase in the case number.

    On Wednesday, European investors are focused on the block of macroeconomic statistics on business activity in Germany and the EU. Analysts predict the data to be poor, so there is no expectation of noticeable growth in the single currency.

    Support and resistance

    On the daily chart, Bollinger bands actively grow. The price range narrows, indicating the emergence of flat dynamics in the short term. MACD grows but keeps a sell signal (the histogram is below the signal line). Stochastic grows but rapidly approaches its highs, indicating that EUR may become overbought in the ultra-short term.

    Resistance levels: 1.2200, 1.2243, 1.2270, 1.2300.
    Support levels: 1.2150, 1.2087, 1.2039, 1.2000.


  9. #1169
    Senior Member MikhailLF's Avatar
    Join Date
    Sep 2017
    Posts
    830
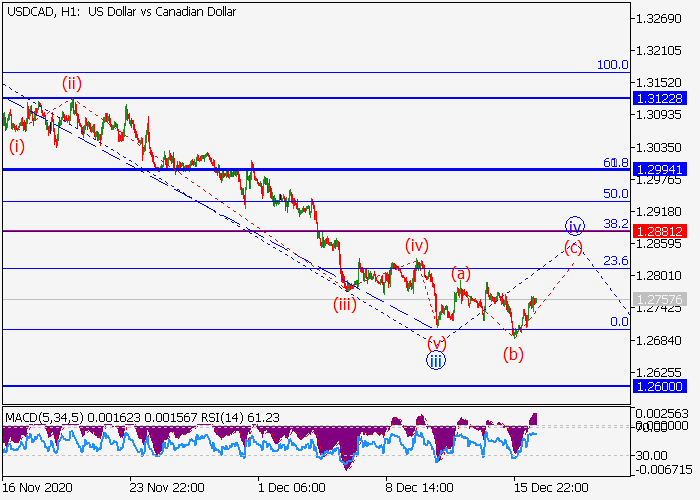
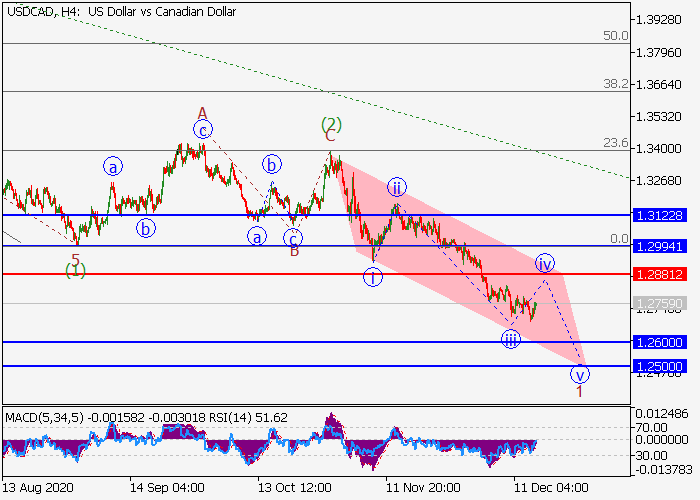
    USD/CAD: wave analysis

    The pair is in a correction, a fall is possible.

    On the 4-hour chart, a correction of the higher level developed as the wave (2), and the downward wave (3) forms, within which the wave 1 of (3) develops. Now, the third wave of the lower level iii of 1 has formed, and a local correction is developing as the wave iv of 1. If the assumption is correct, after the end of the correction, the pair will fall to the levels of 1.2600–1.2500. In this scenario, critical stop loss level is 1.2881.


  10. #1170
    Senior Member MikhailLF's Avatar
    Join Date
    Sep 2017
    Posts
    830
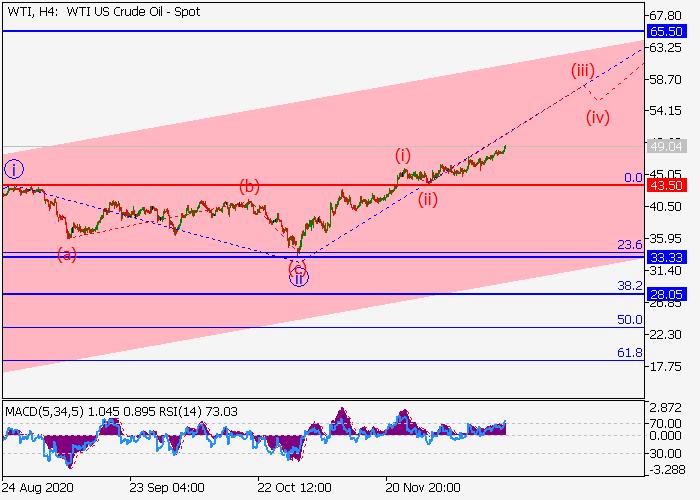
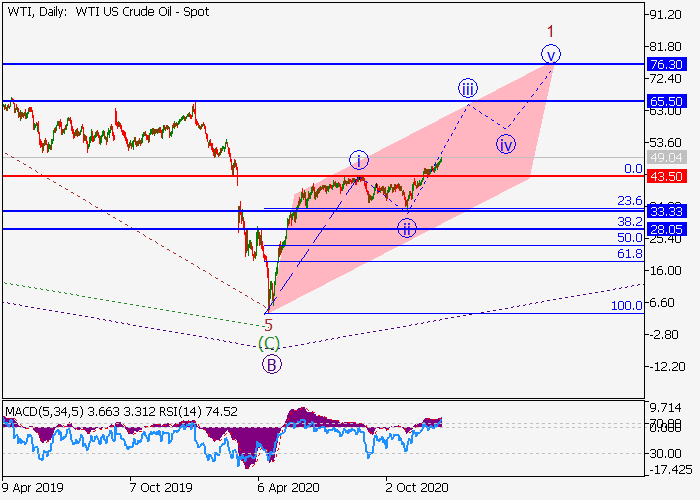
    WTI Crude Oil: wave analysis

    The price may grow.

    On the daily chart, a downward correction of the higher level developed as the wave B, and the formation of the upward wave C started, within which the first wave 1 of (1) of C develops. Now, the third wave of the lower level iii of 1 is forming, within which the wave (iii) of iii is developing. If the assumption is correct, the price will grow to the levels of 65.50–76.30. In this scenario, critical stop loss level is 43.50.


Page 117 of 128 FirstFirst ... 17 67 107 115 116 117 118 119 127 ... LastLast

Tags for this Thread

Bookmarks

Posting Permissions

  • You may not post new threads
  • You may not post replies
  • You may not post attachments
  • You may not edit your posts
  •