
 1Likes
 LinkBack URL
 About LinkBacks


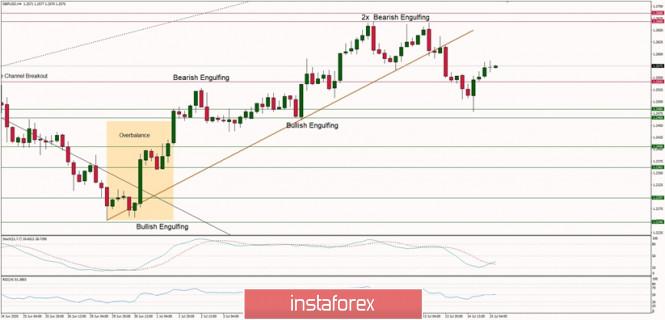
Technical Analysis of GBP/USD for July 6, 2020:
Technical Market Outlook:
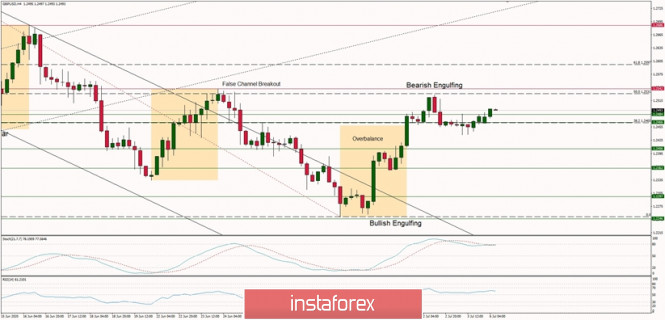
The GBP/USD pair has been hovering around the level of 1.2438 for most part of the weekend, but during the early Monday trading hours the bullish activity has increased. It looks like the bulls might want to test the 50% Fibonacci retracement once again, so in the case of a successful breakout, the next target for them is 61% retracement located at the level of 1.2597. Please notice, there is an important intraday technical resistance located just above 50% Fibonacci retracement at the level of 1.2542. On the other hand, the nearest technical support is still seen at the level of 1.2406 and 1.2362.
Weekly Pivot Points:
WR3 - 1.2879
WR2 - 1.2698
WR1 - 1.2610
Weekly Pivot - 1.2423
WS1 - 1.2323
WS2 - 1.2148
WS3 - 1.2056
Trading Recommendations:
On the GBP/USD pair the main trend is down, which can be confirmed by the down candles on the weekly time frame chart. The key long-term technical support has been recently violated (1.1983) and the new one is seen at the level of 1.1404. The key long-term technical resistance is seen at the level of 1.3518. Only if one of these levels is clearly violated, the main trend might reverse (1.3518) or accelerate (1.1404). The market might have done a Double Top pattern at the level of 1.2645, so the price might move even lower in the longer-term.
Analysis are provided byInstaForex.


 Reply With Quote


Bookmarks