Page 59 of 163 FirstFirst ... 9 49 57 58 59 60 61 69 109 159 ... LastLast
Results 581 to 590 of 1626

Wave Analysis by InstaForex

This is a discussion on Wave Analysis by InstaForex within the Analytics and News forums, part of the Trading Forum category; Forecast for GBP/USD on January 13, 2020 Quotes of the British pound are held for two days on the indicator ...


  1. #581
    Member
    Join Date
    Sep 2015
    Posts
    94
    Forecast for GBP/USD on January 13, 2020

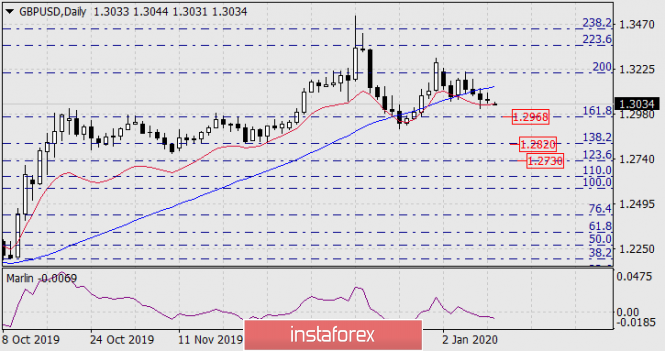
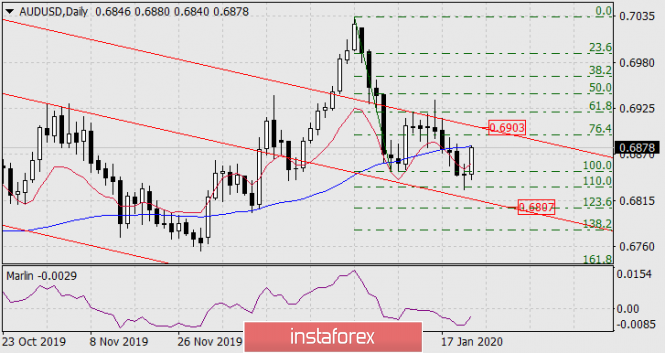
    Quotes of the British pound are held for two days on the indicator line of the balance of the daily scale in red. Overcoming it will allow the price to consistently take the three immediate goals at the Fibonacci levels: 1.2968, 1.2820, 1.2730. The Marlin oscillator is in the decline zone.


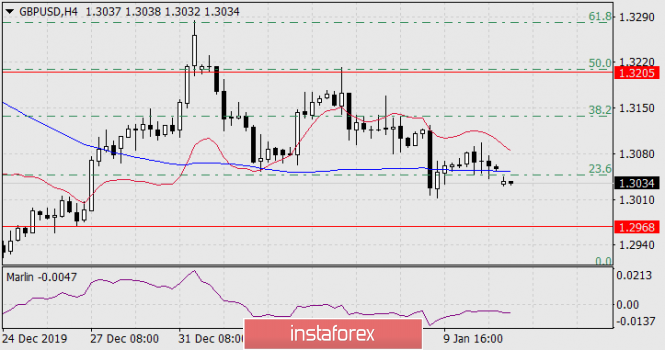
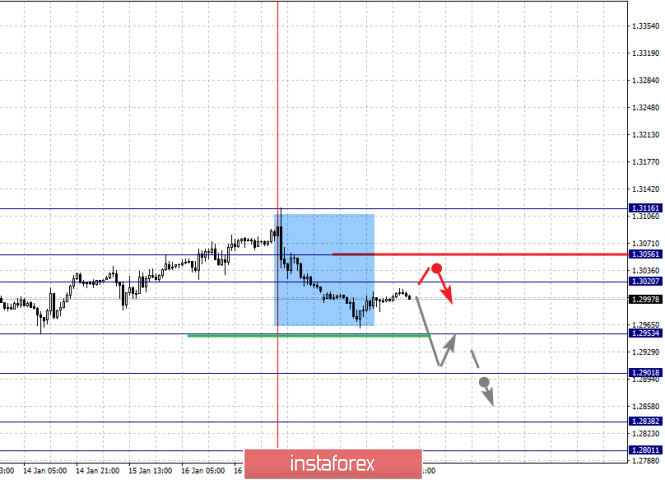
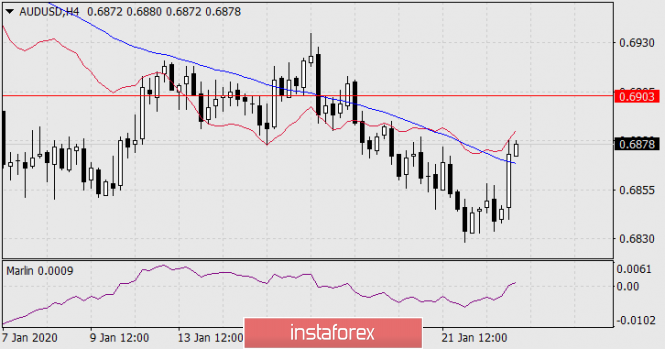
    On the four-hour chart, the price overcame the support of the MACD line, but did so with a gap. In this case, with a general declining trend and in the absence of warning reversal signals, the "window" serves as a harbinger of a further fall in prices, but it is not advisable for it to remain open for a long time.


    We are waiting for the closure of this gap and a further decline in the British pound. The Marlin oscillator is developing in a declining trend zone.


    *The market analysis posted here is meant to increase your awareness, but not to give instructions to make a trade.

  2. #582
    Senior Member InstaForex Gertrude's Avatar
    Join Date
    Sep 2015
    Posts
    1,885
    Forecast for USD/JPY on January 14, 2020

    USD/JPY
    Stock indices of the US market continue to set new records, along with them are rising Japanese indices and the USD/JPY pair. Yesterday, the S&P 500 grew by 0.70%, while the Nikkei 225 is adding a comparable 0.73% today. The China A50 Chinese stock index is up 0.40%, obviously, awaiting tomorrow's signing of the first part of a trade agreement with the United States. The United States also excluded China from the list of currency manipulators. Also, US corporate reports for the fourth quarter of 2019 are starting, forecasts are optimistic. Today, the largest banks are set to report: Citigroup (earnings forecast of $1.84 per share versus $1.61 in the third quarter), JPMorgan Chase & Co (forecast of $2.34 versus $1.98 earlier), Wells Fargo ($1.12 versus $1.21, but also good). Market growth may continue.


    So, if the price goes above the resistance of the red line of the price channel, we are waiting for the price in the target range of 110.83/98 formed by the extreme on November 27, 2017 and February 11, 2016. Here is the Fibonacci level of 123.6% of the growth branch from August 26 to December 2. The indicated trend line (110.26) is the upper limit of the downward price channel originating in August 2015, this is its important - overcoming the line can trigger the pair's growth by another order of two or three figures. The strength of the channel boundary is supported by the Fibonacci level of 110.0%.


    On the four-hour chart, the Marlin forms a divergence, perhaps before attacking the upper boundary of the price channel, the price will subside to the support of the MACD line on daily (109.50).

    *The market analysis posted here is meant to increase your awareness, but not to give instructions to make a trade.

    Analysis are provided byInstaForex.
    Best regards, PR Manager
    Learn more about InstaForex Company at http://instaforex.com

  3. #583
    Senior Member InstaForex Gertrude's Avatar
    Join Date
    Sep 2015
    Posts
    1,885
    Forecast for EUR/USD on January 15, 2020

    EUR /USD
    The dollar slightly strengthened on Tuesday, with the release of inflation data for the United States, but investors found the data not sufficient enough for a more decisive offensive. As a result, the euro showed a decline of only five points by the close of the day. The basic consumer price index added 0.1% for December against the expected 0.2%, while maintaining an annual value of 2.3%.


    On the daily chart, the signal line of the Marlin oscillator moves sideways directly along the boundary of the bullish and bearish trends, which creates the risk of continued correctional growth to the Fibonacci level of 110.0% at the price of 1.1155. If the potential is not realized, a planned decrease to the Fibonacci level of 123.6% will follow at the price of 1.1073, where the MACD indicator line also passes.


    On the four-hour chart, a price reversal from the MACD line was noted, but not fully realized. At the moment, the price is already above the balance line (red moving) and the Marlin oscillator is holding in the growth zone, which shows the price's intention to once again attack the MACD line. Now the condition for a further decrease is overcoming the price of yesterday's low.

    In general, the situation is neutral and the euro may cheer up today's data on industrial production for November (forecast 0.3%), but tomorrow retail sales in the US for December will be released, the forecast for which is 0.5% for basic sales and 0.3% for general . It is likely that investors are planning more active actions for this data.

    *The market analysis posted here is meant to increase your awareness, but not to give instructions to make a trade.

    Analysis are provided byInstaForex.
    Best regards, PR Manager
    Learn more about InstaForex Company at http://instaforex.com

  4. #584
    Senior Member InstaForex Gertrude's Avatar
    Join Date
    Sep 2015
    Posts
    1,885
    Gold has come to life

    The storm continues to rage in the gold market. Despite the fact that only two weeks have passed since the beginning of the year, the precious metal has already managed to go to 7-year highs, collapse like a stone, and then begin to recover thanks to bad news about the trade war. Bloomberg is actively spreading rumors that tariffs on $360 billion of Chinese imports will remain in force, at least until the US presidential election, because the White House needs to assess how Beijing is fulfilling its obligation to increase purchases of American agricultural and other products. The trade war, which has lasted just under two years, does not seem to be going to stop, which means that demand for safe-haven assets will remain high.

    The conflict in the Middle East is gradually fading. The market is dominated by the view that the current XAU/USD correction is due to the mass closure of long speculative positions. Hedge funds in the week of January 7 increased them to the highest level since the end of September, probably hoping that the confrontation between US and Iran will be long-lasting. Some are still hoping for it. The Standard Chartered Bank notes that the price movement due to geopolitics was stronger than previously expected. HSBC raised its forecast for gold for 2020 from $1560 to $1613 per ounce.

    In my opinion, the reasons for the strengthening of the precious metal should not be found in geopolitics, but in the activities of central banks, in politics and in trade disputes instead. The Fed has made it clear that even exceeding the 2% inflation target will not force it to abandon passive behavior. The regulator is ready to endure the acceleration of consumer prices during the period of economic expansion, which is good news for the "bulls" on XAU/USD. The precious metal is traditionally perceived as a tool for hedging inflation risks, asits dynamics have a lot in common with the changes in the US CPI.

    The dynamics of gold and American inflation:


    The dog is buried in the increased sensitivity of gold to the real yield of US Treasury bonds. In December, inflation in the United States grew by 2.3%. This is the second best indicator for a calendar year since 2011, when its growth rate was at 3%. In 2018, consumer prices rose by 1.9%, and by 1.6% on average for 10 years.

    Another factor supporting XAU / USD is the propensity of the world's leading central banks to ultra-soft monetary policy, which keeps global debt market rates close to historical lows. At the same time, a large-scale monetary stimulus contributes to the devaluation of currencies, which increases the attractiveness of gold. If global GDP does not recover as quickly as expected, regulators will further weaken monetary policy. With tariffs on $360 billion of Chinese imports still in place, this is more than likely.

    Technically, after reaching the target of 113% for the "Shark pattern", a natural pullback to the 38.2% Fibonacci correction level followed. Important Pivot levels are also located here. The fact that the "bulls" managed to hold support at $1545-1548 per ounce, the hopes of restoring the upward trend remains.

    Gold, daily chart


    *The market analysis posted here is meant to increase your awareness, but not to give instructions to make a trade.

    Analysis are provided byInstaForex.
    Best regards, PR Manager
    Learn more about InstaForex Company at http://instaforex.com

  5. #585
    Senior Member InstaForex Gertrude's Avatar
    Join Date
    Sep 2015
    Posts
    1,885
    Prospects and trends for gold in January and February 2020

    The consolidation in the gold market ended with the New Year holidays as well as rocket salvos in Iraq, where the United States killed the commander of the Kudes Iranian unit, Qassem Soleimani. Thank God, the global war did not happen, but the nerves of the investors completely lost, and they rushed to buy gold in full accordance with the forecast published in early December 2019. However, the time has come to look at the prospects of the precious metal and make adjustments to the assessment of the situation.

    As we know, the position of traders in futures contracts traded on the CME exchange has the greatest impact on the price of gold. The latest data from the Traders Obligations Report - Commitments of Traders (COT) Reports, published by the US Commodity Futures Commission - CFTC, indicates an increase in the volume of new money entering the market. In addition, the Open Interest of the gold futures contract grew from 926 thousand to 1197 thousand contracts, or almost one third between November 29 and January 10.


    Such an increase in the interest of market participants in gold, which took place against the backdrop of a rise in stock indices, suggests that the departure of the price of gold to the level of $ 1,600 per troy ounce was not an accident caused by the geopolitical situation. The assassination of the general was just an excuse for the precious metal to begin to rise again after a period of consolidation that lasted until the end of the fourth quarter.

    Moreover, it is very important that the increase in the price of gold was supported by speculators Managed Money, whose long positions during the period from December to January grew from 225 thousand to 300 thousand contracts. According to the CFTC classification, Managed Money are a priori net buyers. Thus, the demand for gold from buyers was accompanied by the opening of new positions in the futures contract, which suggests fundamental reasons for the continuation of the current trend. Due to this, exchange traders felt the potential and began to increase positions.

    If the increase in the price of gold was caused only by the development of events in the Middle East, then, firstly, we would not see a constant influx of new money that occurred in December, and secondly, Managed Money, which are speculators, could simply not react on the events that are happening.

    So, for example, what happened in September 2019 and January 2020 in the oil market. The attack on the Saudi oil infrastructure was not supported by the influx of new money into the market, and speculators were in no hurry to open new long positions, which subsequently led to a decrease in oil prices. No demand - no price increase. In December, speculators bought oil, but almost no new positions were opened in the futures, which led to a decrease in oil prices as soon as the situation in the Persian Gulf area stabilized.

    However, we have an increase in Open Interest in gold and an increase in purchases by speculators at the same time, which qualitatively distinguishes this situation from the situation in the oil market. On the other hand, the price of gold declined slightly after the crisis between Iran and the United States was resolved, and this is natural, but do not be fooled by the possibility of a potential reversal, since most likely there will not be a deep decline in the gold market.

    We will analyze the positioning of traders in option contracts. The most liquid option contract now is the February contract OGG0 with the closure on January 28 (Fig. 1).


    Figure 1: Open Interest in an OGGO Option Contract.

    First of all, the significant predominance of "call" options over "put" options is noteworthy. The Put / Call Ratio coefficient is 0.71. This means that there are only 71 Put options for every 100 Call options. In the context of the growth of Open Interest, optional barriers may not withstand and miss the price higher. With this ratio, the importance of the Max Pain point located at 1500 also decreases, and returning to this point at the time the option contract expires is becoming less and less likely. This must be taken into account when opening gold sales positions. Option barriers hold the price well, but only when there is no trend on the market.

    In this regard, it can be assumed that the levels of optional support are at 1510 and 1500. There are also graphic levels of price support, where gold can return by the end of the month for purely technical reasons. After that, there is a possibility of further price growth over the next three to six months, which implies a rise in gold to the level of $ 1,750 per troy ounce. Thus, sales to the levels of 1,500-1,510 dollars will be inappropriate, but such a price can be an ideal point for buying gold, unless, of course, by that time there will be a change in the mood of buyers in the futures market. Short-term goals for such purchases may be levels 1500, 1575 and 1600, formed by options such as "Call".

    Today, the World Gold Council - published its forecast for 2020. The forecast indicates the main factors that, in the opinion of the Council, will affect the price of gold this year. It is assumed that financial uncertainty and low interest rates in most developed economies will support the price of gold, as investors will seek new sectors to protect investments and generate income. As a result, demand from central banks will also remain high. This, combined with investor interest, will allow gold to be added back to its value in all currencies.

    According to WGC experts, the price impulse and positioning of traders will also support the price of gold. At the same time, volatility and expectations of weaker economic growth in the short term may lead to softer consumer demand, but structural economic reforms in India and China will support consumer demand in the long term.

    Thus, traders trading can earn on price fluctuations by selling and buying precious metals on the best trading conditions, but investors should not forget that gold has provided them with a yield higher than the US dollar over the past twenty years, while performing a protection function risk investment.

    By investing in gold and trading it in the short term, an investor can not only profit from fluctuations in price quotes, but also insure himself against unforeseen market risks. Be very careful and follow the rules of money management.

    *The market analysis posted here is meant to increase your awareness, but not to give instructions to make a trade.

    Analysis are provided byInstaForex.
    Best regards, PR Manager
    Learn more about InstaForex Company at http://instaforex.com

  6. #586
    Senior Member InstaForex Gertrude's Avatar
    Join Date
    Sep 2015
    Posts
    1,885
    Control zones of USDJPY 1/20/2020

    Last week's movement made it possible for a local accumulation zone to form. This happened within the average monthly move, which indicates the presence of limit sell orders. Purchases from current levels are not profitable, since the probability of closing the trade in January is above the zone of the monthly move below 30%. A model has not yet been formed for selling, which indicates the need to switch to standby mode.


    Keeping part of the purchases opened at the beginning of this month is the optimal strategy, since the probability of absorption of the latest growth from current levels is below 20%.

    To enter a short position requires the formation of an absorption pattern at the daily level. Closing of trading on Monday should occur below the low of last week. This will indicate the appearance of a major offer from significant market players. Work in the downward direction is more profitable, since the monthly range of the average stroke has already been overcome by the pair....


    Daily CZ - daily control zone. The area formed by important data from the futures market, which changes several times a year.
    Weekly CZ - weekly control zone. The zone formed by important marks of the futures market, which changes several times a year.
    Monthly CZ - monthly control zone. The zone, which is a reflection of the average volatility over the past year.

    *The market analysis posted here is meant to increase your awareness, but not to give instructions to make a trade.

    Analysis are provided byInstaForex.
    Best regards, PR Manager
    Learn more about InstaForex Company at http://instaforex.com

  7. #587
    Senior Member InstaForex Gertrude's Avatar
    Join Date
    Sep 2015
    Posts
    1,885
    Fractal analysis for major currency pairs on January 21

    Forecast for January 21:
    Analytical review of currency pairs on the scale of H1:


    For the euro / dollar pair, the key levels on the H1 scale are: 1.1131, 1.1115, 1.1102, 1.1079, 1.1064 and 1.1031. Here, we are following the descending structure of January 16.

    Short-term downward movement is expected in the range of 1.1079 - 1.1064. The breakdown of the last value will lead to a pronounced movement. Here, the potential target is 1.1031. We expect a pullback to the top from this level. Short-term upward movement is possibly in the range 1.1102 - 1.1159. The breakdown of the last value will lead to an in-depth correction. Here, the target is 1.1131. This level is a key support for the downward structure.

    The main trend is the descending structure of January 16

    Trading recommendations:
    Buy: 1.1102 Take profit: 1.1113
    Buy: 1.1116 Take profit: 1.1130
    Sell: 1.1078 Take profit: 1.1065
    Sell: 1.1063 Take profit: 1.1034


    For the pound / dollar pair, the key levels on the H1 scale are: 1.3116, 1.3056, 1.3020, 1.2953, 1.2901, 1.2838 and 1.2801. Here, we are following the formation of the descending structure of January 17. The continuation of the movement to the bottom is expected after the breakdown of the level of 1.2953. In this case, the target is 1.2901. Price consolidation is near this level. The breakdown of the level of 1.2900 will lead to the development of pronounced movement. Here, the goal is 1.2838. For the potential value for the bottom, we consider the level of 1.2801. Upon reaching which, we expect a pullback to the top.

    Short-term upward movement is possibly in the range of 1.3020 - 1.3056. The breakdown of the latter value will lead to the formation of initial conditions for the upward cycle. Here, the potential target is 1.3116.

    The main trend is the descending structure of January 17

    Trading recommendations:
    Buy: 1.3020 Take profit: 1.3053
    Buy: 1.3057 Take profit: 1.3114
    Sell: 1.2952 Take profit: 1.2904
    Sell: 1.2898 Take profit: 1.2838


    For the dollar / franc pair, the key levels on the H1 scale are: 0.9778, 0.9758, 0.9725, 0.9699, 0.9668, 0.9654, 0.9632 and 0.9610. Here, the price forms the expressed initial conditions for the top of January 16. The continuation of the movement to the top is expected after the breakdown of the level of 0.9700. In this case, the target is 0.9725. Price consolidation is near this level. The breakdown of the level of 0.9725 will lead to pronounced movement. Here, the target is 0.9758. For the potential value for the top, we consider the level of 0.9778. Upon reaching this level, we expect a pullback to the bottom.

    Short-term downward movement is possibly in the range of 0.9668 - 0.9654. The breakdown of the latter value will lead to an in-depth correction. Here, the target is 0.9632. This level is a key support for the top.

    The main trend is the formation of initial conditions for the top of January 16

    Trading recommendations:
    Buy : 0.9700 Take profit: 0.9725
    Buy : 0.9727 Take profit: 0.9756
    Sell: 0.9667 Take profit: 0.9655
    Sell: 0.9652 Take profit: 0.9635


    For the dollar / yen pair, the key levels on the scale are : 111.38, 110.78, 110.39, 109.81, 109.58 and 109.23. Here, we are following the development of the upward cycle of January 8. At the moment, we expect to reach the level of 110.39. The breakdown of which will allow us to count on movement to the level of 110.78. Price consolidation is near this value. The breakdown of the level of 110.80 should be accompanied by a pronounced upward movement. Here, the potential target is 111.38. Short-term downward movement is possibly in the range 109.81 - 109.58. The breakdown of the last value will lead to an in-depth correction. Here, the goal is 109.23. This level is a key support for the top. The main trend: the upward cycle of January 8.

    Trading recommendations:
    Buy: 110.40 Take profit: 110.76
    Buy : 110.80 Take profit: 111.35
    Sell: 109.80 Take profit: 109.58
    Sell: 109.55 Take profit: 109.25


    For the Canadian dollar / US dollar pair, the key levels on the H1 scale are: 1.3157, 1.3126, 1.3112, 1.3090, 1.3062, 1.3040 and 1.3015. Here, we are following the development of the upward cycle of January 7. The continuation of the movement to the top is except after the breakdown of the level of 1.3090. In this case, the target is 1.3112. Price consolidation is in the range of 1.3112 - 1.3126. For the potential value for the top, we consider the level of 1.3157. Upon reaching this level, we expect a pullback to the bottom.

    Short-term downward movement, as well as consolidation are possible in the range of 1.3040 - 1.3015. The breakdown of the latter value will lead to the formation of initial conditions for the downward cycle. In this case, the potential target is 1.2988.

    The main trend is the upward cycle of January 7, the correction stage

    Trading recommendations:
    Buy: 1.3090 Take profit: 1.3112
    Buy : 1.3126 Take profit: 1.3155
    Sell: 1.3038 Take profit: 1.3017
    Sell: 1.3013 Take profit: 1.2990


    For the Australian dollar / US dollar pair, the key levels on the H1 scale are : 0.6933, 0.6901, 0.6885, 0.6853, 0.6820, 0.6803 and 0.6780. Here, we are following the development of the descending structure of January 16. The continuation of movement to the bottom is expected after the breakdown of the level of 0.6853. In this case, the target is 0.6820. Price consolidation is in the range of 0.6820 - 0.6803. For the potential value for the bottom, we consider the level of 0.6780. Upon reaching this level, we expect a pullback to the top.

    Short-term upward movement is expected in the range of 0.6885 - 0.6901. The breakdown of the latter value will lead to the formation of initial conditions for the top. In this case, the potential target is 0.6933. The main trend is the descending structure of January 16

    Trading recommendations:
    Buy: 0.6885 Take profit: 0.6900
    Buy: 0.6904 Take profit: 0.6930
    Sell : 0.6851 Take profit : 0.6823
    Sell: 0.6820 Take profit: 0.6804


    For the euro / yen pair, the key levels on the H1 scale are: 123.89, 123.32, 123.06, 122.68, 122.09, 121.80 and 121.47. Here, we are following the development of the upward cycle of January 8. The continuation of the movement to the top is expected after the breakdown of the level of 122.68. In this case, the first target is 123.06. Short-term upward movement, as well as consolidation is in the range of 123.06 - 123.32
    .The breakdown of the level of 123.35 will lead to a movement to a potential target - 123.89, from this level, we expect a pullback to the bottom.

    Short-term downward movement is possibly in the range of 122.09 - 121.80. The breakdown of the latter value will lead to an in-depth correction. Here, the goal is 121.47. This level is a key support for the upward structure.

    The main trend is the upward cycle of January 8, the correction stage

    Trading recommendations:
    Buy: 122.70 Take profit: 123.05
    Buy: 123.06 Take profit: 123.30
    Sell: 122.07 Take profit: 121.84
    Sell: 121.80 Take profit: 121.50


    For the pound / yen pair, the key levels on the H1 scale are : 146.41, 145.55, 144.93, 144.53, 143.98, 143.07, 142.59 and 142.11. Here, we are following the development of the ascending structure of January 3. At the moment, the price is in correction. The resumption of movement to the top is expected after the breakdown of the level of 144.00. In this case, the first goal is 144.53. Short-term upward movement is expected in the range of 144.53 - 144.93. The breakdown of the latter value will lead to a movement to the level of 145.55, and near which, we expect consolidation. For the potential value for the top, we consider the level of 146.41, from which we expect a pullback to the bottom.

    Short-term downward movement is possibly in the range of 143.07 - 142.59. The breakdown of the latter value will lead to the formation of initial conditions for the downward cycle. In this case, the potential target is 142.11.

    The main trend is the upward structure of January 3, the correction stage

    Trading recommendations:
    Buy: 144.00 Take profit: 144.51
    Buy: 144.53 Take profit: 144.91
    Sell: 143.05 Take profit: 142.65
    Sell: 142.54 Take profit: 142.11

    Analysis are provided byInstaForex.
    Best regards, PR Manager
    Learn more about InstaForex Company at http://instaforex.com

  8. #588
    Senior Member InstaForex Gertrude's Avatar
    Join Date
    Sep 2015
    Posts
    1,885
    Technical analysis recommendations for USD/JPY and its crosses

    USD / JPY


    The yen began in 2020 with the realization of what did not work out last year. So far, the pair closed the week in the bullish zone of the relative weekly cloud. Now, the main task of the players is fixing in this zone to increase in the near future. After that, monthly resistance will follow 110.70 - 110.83 - 111.40. However, breaking through the monthly boundaries is a more difficult task, since this will eliminate the monthly dead cross and mark the exit to the bullish zone of the relative Ichimoku cloud at the most upper time. In this situation, support is located at 109.50 (weekly cloud + monthly medium-term trend + daily short-term trend) - 109 (weekly Tenkan and the lower border of the cloud + daily Kijun and the upper border of the cloud) - Fixing below 108.08-30 can move players away from their goals for a long time.

    EUR / JPY


    At the beginning of the year, the pair attempted a new test of important resistance, but the first target of the daily target for breakdown of the cloud (122.55), now strengthened by the lower border of the weekly cloud (122.71), withstood the defense again. As a result, we observe the next development of a downward correction. The nearest support is the daytime cross of Ichimoku, first Tenkan (121.96), then Kijun (121.48), as well as the most protected area 121.24 (weekly Tenkan + daytime cloud + final line of the daytime cross of Ichimoku). At the same time, securing below can significantly affect the current balance of power, opening up new prospects for players to decline.

    GBP / JPY


    The pound / yen is trying to gain a foothold and stay in the bullish zone relative to the weekly cloud, using the cloud as support. Now, the main attention of the players to increase is aimed at breaking through the weekly short-term trend (143.65) and eliminating the dead crosses of Ichimoku at the daily (144.38 - 145.21) and monthly (145.07) time intervals. Moreover, breaking through these resistance forms new horizons and opportunities before the players to increase. The nearest support, in turn, can now be identified at 141.54 (monthly medium-term trend + daily cloud) and 140.34 - 139.12 (weekly levels + lower border of the daily cloud). Fixing below will change the existing balance and can lead to an active recovery of bearish sentiment.

    Ichimoku Kinko Hyo (9.26.52), Pivot Points (classic), Moving Average (120)

    Analysis are provided byInstaForex.
    Best regards, PR Manager
    Learn more about InstaForex Company at http://instaforex.com

  9. #589
    Senior Member InstaForex Gertrude's Avatar
    Join Date
    Sep 2015
    Posts
    1,885
    Forecast for AUD/USD on January 23, 2020

    AUD / USD

    The Australian dollar absorbed a positive market sentiment relative to the British pound yesterday, and just this morning, this news was actively played back on the positive employment data. By December, about 29 thousand people got a job, this is contrary and higher than the 15 thousand on the forecast. This makes the overall unemployment rate fell from 5.2% to 5.1%. In the Asian session, the growth of the "Australian dollar" graduated to 34 points, and the price exactly reached the MACD line on the daily chart. In the European session, exit above the line 0.6880 with consolidation above it and on Friday, the growth may extend to the price channel line 0.6903.


    The price exceeded the MACD line on the four-hour chart but is still under the balance line, which means that the situation is developing mainly according to the older chart. For this day, everything will depend on whether the price can fix itself above the MACD line on the daily chart. The signal line of the Marlin oscillator in the zone of positive values is already a sign of the price's intention to overcome the resistance of the senior TF, but in any scenario this growth is corrective.


    *The market analysis posted here is meant to increase your awareness, but not to give instructions to make a trade.

    Analysis are provided byInstaForex.
    Best regards, PR Manager
    Learn more about InstaForex Company at http://instaforex.com

  10. #590
    Senior Member InstaForex Gertrude's Avatar
    Join Date
    Sep 2015
    Posts
    1,885
    EUR/USD: Christine Lagarde pessimism and panic over 2019-nCoV

    The euro-dollar pair is plunging down: at the moment, the bears are trying to gain a foothold below the support level of 1.1050 in order to discover the way to the area of the ninth figure. Although in the morning the pair showed corrective growth, in the hope of hawkish notes from the ECB. But to the disappointment of the EUR/USD bulls, Thursday events turned against the European currency. And it's not just because of Christine Lagarde's overly cautious rhetoric. The financial world today has finally succumbed to panic about the spread of the deadly 2019-nCoV virus. Demand for defensive assets has increased again, as well as that for the US currency, which many investors use as a kind of safe-haven in times of heightened uncertainty. In other words, the EUR/USD bulls hope for a resumption of the upward trend burst like a soap bubble - Lagarde could not support the single currency, while the anti-risk sentiment only increased the pressure on the pair.


    The European Central Bank today, quite expectedly, left all the parameters of monetary policy unchanged. In its accompanying statement, the regulator indicated that the ECB rates will remain at the current "or lower level" until inflation approaches the target two percent level "or close enough to this target". This wording was not a surprise to traders. The only innovation in the final communique is the announcement that the ECB will conduct a strategic review of its policy (for the first time in 17 years). However, firstly, this process will take about a year, and secondly, the regulator has not yet shared any details regarding the scope of the policy review. Therefore, the main attention of traders today was riveted to the press conference of Christine Lagarde.

    It cannot be said that the head of the ECB took a peremptory-dovish position. Not at all. During her speech, she, in particular, stated that "current rates are worrisome," therefore, in the future, the regulator will take into account the collateral effect of low rates. This statement suggests that there is still a split in the ECB, which appeared back in September last year, when Mario Draghi "pushed" the decision to resume QE. Some of the central bank members then also expressed their concern about the side effect of negative rates.

    However, the above remark could not provide the euro with long-term support. Lagarde generally maintained a pessimistic stance on the current situation. First of all, according to the head of the ECB, industrial production is a "brake"on the European economy. On the whole, the existing risks are "tilted downward," although they are less pronounced compared to last year. Despite the signing of the first phase of a trade deal between the US and China, the ECB continues to be concerned about this protracted trade conflict. Lagarde uttered a rather capacious phrase on this subject: "... geopolitics is a threat that leaves the door open for accommodation policy." At the same time, Lagarde rather modestly commented on the growth of European inflation. According to her, the regulator noted "some signs of growth", however, these trends "correspond to earlier expectations". Summing up the January meeting, the head of the ECB said that monetary policy will remain stimulating "for a long period of time", despite some signs of stabilization of the situation in the eurozone.

    Buyers of the EUR/USD pair certainly expected more from today's meeting. Previous macroeconomic releases made it possible to count on a more hawkish tone by the central bank chief. Therefore, following the meeting, the pair updated the daily low. But ironically, the press conference of Lagarde coincided with a general increase in anti-risk sentiment in the markets. For example, the yen paired with the greenback fell to the bottom of the 109th figure, and the dollar index jumped to a one-month high (the last time it was at 97.57 points in early December), reflecting investor demand for defensive instruments. Stock indices - on the contrary, collapsed.


    Asian markets have been hit hardest. In particular, the Hong Kong Hang Seng index fell 2.8%, the Shanghai blue chips index fell 1.7%, and the Japanese Nikkei lost 0.9%. The shares of tourism and passenger transportation companies (including airlines) fell most strongly. There is growing concern in financial markets that a virus spreading from China could slow global growth. Cases of infection have already been recorded in Taiwan, Thailand, Japan, South Korea, Saudi Arabia and the United States. The authorities of the PRC quarantined two cities in Hubei province (including the 11 millionth Wuhan), canceling all the large-scale events in Beijing dedicated to the celebration of the New Year on the lunar calendar (January 25).

    Such unprecedented measures have reminded traders of the effects of the 2003 pneumonia epidemic. Then the key countries of the Asian region in total lost, according to various estimates, from 30 to 40 billion dollars. (first of all, the tourism sector has suffered). The oil market fell then, due to a significant decrease in air transportation, and, accordingly, the demand for aviation fuel and crude oil.

    It is worth noting that at the moment it is impossible to say with certainty that a repetition of the year 2003 awaits us, however, in the context of the prospects of the foreign exchange market (and directly the EUR/USD pair), the very fact that traders succumbed to panic is important. If the situation with the spread of the virus will gain momentum, the pair will continue to decline, despite the other fundamental factors. So far, the EUR/USD bulls are defending - the bears have failed to gain a foothold below the support level of 1.1050. But in the event of an increase in anti-risk sentiment, buyers of the pair will not be able to maintain this level - the price will drop to the ninth figure.

    *The market analysis posted here is meant to increase your awareness, but not to give instructions to make a trade.

    Analysis are provided byInstaForex.
    Best regards, PR Manager
    Learn more about InstaForex Company at http://instaforex.com

Page 59 of 163 FirstFirst ... 9 49 57 58 59 60 61 69 109 159 ... LastLast

Tags for this Thread

Bookmarks

Posting Permissions

  • You may not post new threads
  • You may not post replies
  • You may not post attachments
  • You may not edit your posts
  •