Page 40 of 166 FirstFirst ... 30 38 39 40 41 42 50 90 140 ... LastLast
Results 391 to 400 of 1651

Wave Analysis by InstaForex

This is a discussion on Wave Analysis by InstaForex within the Analytics and News forums, part of the Trading Forum category; Trading plan for EUR/USD for March 26, 2019 Technical outlook: The EUR/USD pair has stalled below the 1.1340 levels after ...


  1. #391
    Senior Member InstaForex Gertrude's Avatar
    Join Date
    Sep 2015
    Posts
    1,885
    Trading plan for EUR/USD for March 26, 2019


    Technical outlook:
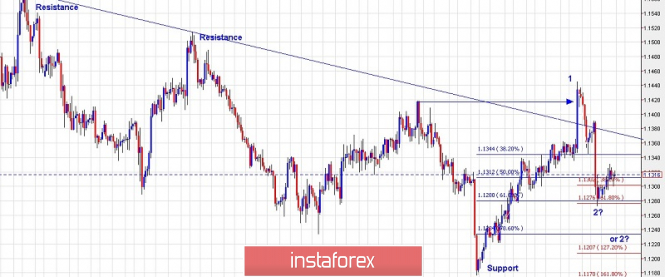
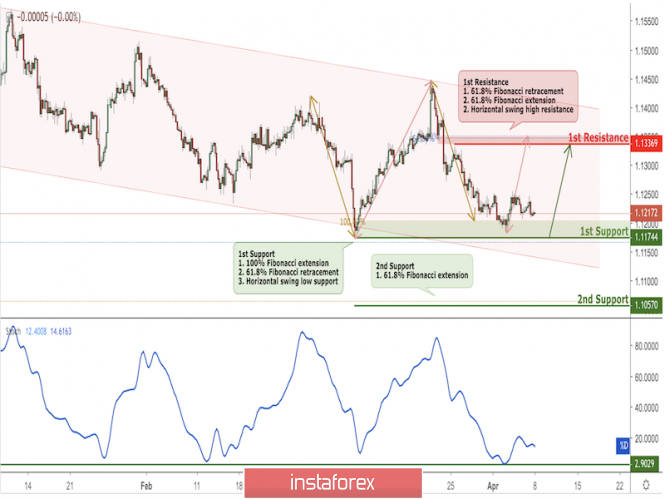
    The EUR/USD pair has stalled below the 1.1340 levels after finding support at the 1.1273 levels last week. Please note that the prices should remain above the 1.1273 levels for bulls to remain in control. In a broader sense, the 1.1175 levels should be held if EUR/USD needs to rally towards the 1.16/1.17 levels going forward. If we consider the drop after breaking resistance at the 1.1448 levels, it is still in the wave 3, which is corrective. Also note that the Fibonacci 0.786 support comes in at the 1.1240 levels and a bullish bounce is possible. But the price breaking further below the 1.1240 levels would increase the probability of giving up support at the 1.1175 levels. From the trading point of view, it is safe to open long deals, but below the 1.1273 levels. The price action unfolding in the next 1-2 trading sessions would confirm whether EUR/USD is going to produce an extended rally towards the 1.1800 levels or not.

    Trading plan:
    Aggressive traders, remain long with a stop loss order below 1.1273, the target is open.
    Conservative traders, remain flat for now.

    Analysis are provided byInstaForex.
    Best regards, PR Manager
    Learn more about InstaForex Company at http://instaforex.com

  2. #392
    Senior Member InstaForex Gertrude's Avatar
    Join Date
    Sep 2015
    Posts
    1,885
    Forecast for GBP/USD on March 27, 2019

    Wave Analysis by InstaForex-333.jpg

    GBP/USD
    Yesterday, the British pound made another attempt to exit above the signal level 1.3216, but without success. The marlin oscillator readings did not change on both graphs, they are neutral, signal lines develop along the border that separates the growth zone from the decline zone.

    On the four-hour chart, the price is below the balance line and the MACD line. The immediate target - the MACD line of the daily chart (1.3020), remains relevant. Leaving prices for this target level opens the subsequent target at 1.2884 - the support line for the weekly price channel.

    Analysis are provided byInstaForex.
    Best regards, PR Manager
    Learn more about InstaForex Company at http://instaforex.com

  3. #393
    Senior Member InstaForex Gertrude's Avatar
    Join Date
    Sep 2015
    Posts
    1,885
    Forecast for EUR/USD on March 28, 2019

    EUR/USD This morning, the euro did not reach the target level of 1.2434, but it could still happen during the day, which does not break the convergence with the marlin oscillator on the four-hour scale. But regardless of this level's development, the price prepared the technical conditions for a small correction, in the range of 1.1275-1.1310. The upper limit of the range is due to the MACD line resistance on the four-hour chart.

    Wave Analysis by InstaForex-333.jpg

    Consolidating prices below 1.1234 opens a new target - 1.1155 (Fibonacci reaction level 110.0%

    Analysis are provided byInstaForex.
    Best regards, PR Manager
    Learn more about InstaForex Company at http://instaforex.com

  4. #394
    Senior Member InstaForex Gertrude's Avatar
    Join Date
    Sep 2015
    Posts
    1,885
    Forecast for GBP/USD on March 29, 2019

    GBP/USD
    Yesterday, the British pound fell 114 points. The target of 1.3035 was achieved - support for the MACD line of the daily scale. The price went below the red indicator line of balance, which means a shift in the overall trend downwards, the signal line of the marlin oscillator has penetrated deep into the decline territory.

    Wave Analysis by InstaForex-333.jpg

    On the four-hour chart, the price consolidated below the indicator lines of the balance and MACD, the marlin oscillator indicates the prospect of a further decline in price.

    So, after the price goes below yesterday's low, which automatically means that the price goes under the support of the MACD line on a daily scale, a target of 1.2884 opens - supporting the embedded line of the price channel of the higher timeframe. With the overcoming of this support, it is possible for the price to further decline to the February 14 low - 1.2772.

    Analysis are provided byInstaForex.
    Best regards, PR Manager
    Learn more about InstaForex Company at http://instaforex.com

  5. #395
    Senior Member InstaForex Gertrude's Avatar
    Join Date
    Sep 2015
    Posts
    1,885
    EUR/CAD approaching resistance, potential drop!


    EURCAD is approaching our first resistance at 1.5033 (horizontal overlap resistance, 61.8% Fibonacci extension , 23.6% Fibonacci retracement ) where a strong drop might occur to our major resistance at support at 1.4925 (horizontal swing low support). RSI (34) is also approaching resistance and ichimoku cloud is also showing signs of bearish pressure. Trading CFDs on margin carries high risk. Losses can exceed the initial investment so please ensure you fully understand the risks.

    Analysis are provided byInstaForex.
    Best regards, PR Manager
    Learn more about InstaForex Company at http://instaforex.com

  6. #396
    Senior Member InstaForex Gertrude's Avatar
    Join Date
    Sep 2015
    Posts
    1,885
    NZD/USD approaching support, potential bounce!


    NZDUSD is approaching our first support at 0.67556 (long term ascending support line, horizontal swing low support, 50% Fibonacci retracement , 100% Fibonacci extension ) where a strong bounce might occur above this level to our major resistance at 0.6866 (horizontal overlap resistance, 61.8% Fibonacci retracement ). Stochastic is also approaching support. Trading CFDs on margin carries high risk. Losses can exceed the initial investment so please ensure you fully understand the risks.

    Analysis are provided byInstaForex.
    Best regards, PR Manager
    Learn more about InstaForex Company at http://instaforex.com

  7. #397
    Senior Member InstaForex Gertrude's Avatar
    Join Date
    Sep 2015
    Posts
    1,885
    NZD/USD approaching support, potential bounce!


    NZDUSD is approaching our first support at 0.6744 (long term ascending support line, horizontal swing low support, 50% Fibonacci retracement , 100% Fibonacci extension ) where a strong bounce might occur above this level to our major resistance at 0.6866 (horizontal overlap resistance, 61.8% Fibonacci retracement ). Stochastic is also approaching support. Trading CFDs on margin carries high risk. Losses can exceed the initial investment so please ensure you fully understand the risks.

    Analysis are provided byInstaForex.
    Best regards, PR Manager
    Learn more about InstaForex Company at http://instaforex.com

  8. #398
    Senior Member InstaForex Gertrude's Avatar
    Join Date
    Sep 2015
    Posts
    1,885
    Nikkei approaching resistance, potential drop!


    Nikkei is approaching our first resistance at 22630.1 (horizontal swing high resistance, 61.8% Fibonacci retracement , 61.8% Fibonacci extension ) where a strong drop might occur below this level pushing price down to our major support at 20855.7 (50% Fibonacci retracement , horizontal swing low support). Stochastic (21,5,3) is also approaching resistance where we might see a corresponding drop in price. Trading CFDs on margin carries high risk. Losses can exceed the initial investment so please ensure you fully understand the risks.

    Analysis are provided byInstaForex.
    Best regards, PR Manager
    Learn more about InstaForex Company at http://instaforex.com

  9. #399
    Senior Member InstaForex Gertrude's Avatar
    Join Date
    Sep 2015
    Posts
    1,885
    AUD/USD approaching resistance, potential drop!


    AUDUSD is approaching our first resistance at 0.7145 (horizontal swing high resistance, 78.6% Fibonacci retracement ) where a strong drop might occur below this level pushing price down to our major support at 0.7111 (38.2% Fibonacci retracement , 100% Fibonacci extension ). Stochastic is also approaching resistance where we might see a corresponding drop in price. Trading CFDs on margin carries high risk. Losses can exceed the initial investment so please ensure you fully understand the risks.

    Analysis are provided byInstaForex.
    Best regards, PR Manager
    Learn more about InstaForex Company at http://instaforex.com

  10. #400
    Senior Member InstaForex Gertrude's Avatar
    Join Date
    Sep 2015
    Posts
    1,885
    EUR/USD approaching resistance, potential bounce!


    EURUSD is approaching our first support at 1.11744 (100% Fibonacci extension, 61.8% Fibonacci retracement, horizontal swing low support) where a strong bounce to our first resistance at 1.13369 (horizontal swing high resistance, 61.8% Fibonacci retracement , 61.8% Fibonacci extension ) might occur. Stochastic is also approaching support where we might see a bounce above this level.

    Analysis are provided byInstaForex.
    Best regards, PR Manager
    Learn more about InstaForex Company at http://instaforex.com

Page 40 of 166 FirstFirst ... 30 38 39 40 41 42 50 90 140 ... LastLast

Tags for this Thread

Bookmarks

Posting Permissions

  • You may not post new threads
  • You may not post replies
  • You may not post attachments
  • You may not edit your posts
  •