Page 137 of 165 FirstFirst ... 37 87 127 135 136 137 138 139 147 ... LastLast
Results 1,361 to 1,370 of 1650

Wave Analysis by InstaForex

This is a discussion on Wave Analysis by InstaForex within the Analytics and News forums, part of the Trading Forum category; Forex Analysis & Reviews: AUDUSD Potential for Bullish rise to previous swing high Description : Looking at the H4 chart, ...


  1. #1361
    Member
    Join Date
    Sep 2015
    Posts
    94
    Forex Analysis & Reviews: AUDUSD Potential for Bullish rise to previous swing high


    Description :
    Looking at the H4 chart, my overall bias for AUDUSD is bullish due to the current price being above the Ichimoku cloud, Looking for a buy entry at 0.71277 where the pullback entry and the 1st resistance level. We are looking to take profit at 0.72775, where the previous swing high is and -27.2% Fibonacci line. Stop loss will be placed at 0.69753 where the recent swing low support is.


    Trading Recommendation


    Entry: 0.71277


    Reason for Entry: Ichimoku cloud + price momentum


    Take Profit: 0.72775


    Reason for Take Profit:


    Previous swing high resistance


    Stop Loss: 0.69753


    Reason for Stop Loss:


    recent swing low support


    *The market analysis posted here is meant to increase your awareness, but not to give instructions to make a trade.


    Analysis are provided byInstaForex.


    Read More

  2. #1362
    Member
    Join Date
    Sep 2015
    Posts
    94
    Forex Analysis & Reviews: Forecast for USD/JPY on February 3, 2023


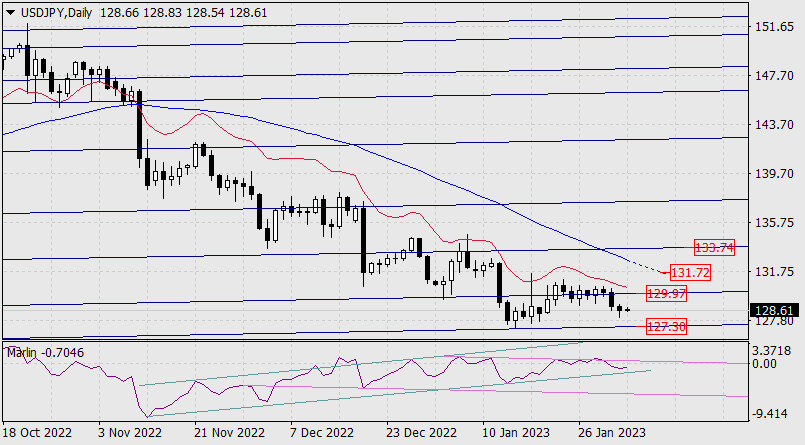
    The Japanese yen got a little stronger after the meetings of the three major central banks, but it only strengthened the neutral position and uncertainty, since it is technically staying between the two lines of the price channel at 127.30 and 129.97.


    The signal line of the Marlin oscillator is in the negative zone, but it has not yet reached the bottom of its own ascending channel (turquoise). Considering the fact that the dollar has been rising against European currencies and the stock market is also rising, I believe that the price will climb above the resistance of 129.97. Then the price may overcome the resistance of the MACD line (131.72), and logically, the breakthrough will end by reaching the resistance of 133.74. The alternative scenario assumes overcoming the support at 127.30 and falling further to the underlying price channel line at 124.10.


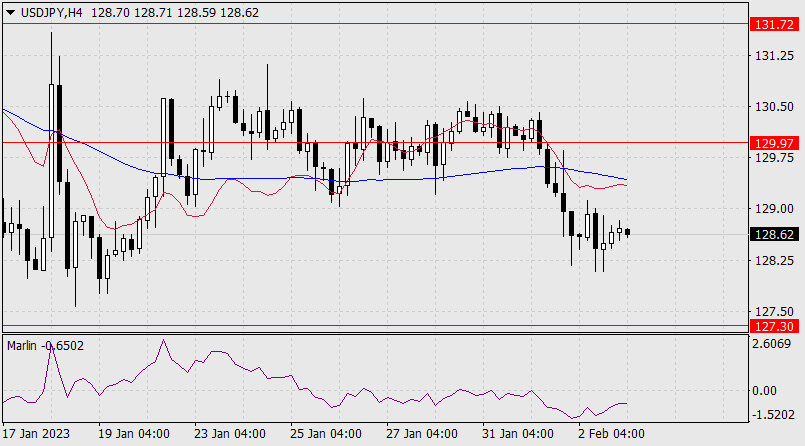
    On the four-hour chart, the price is consolidating under the balance and MACD indicator lines, the Marlin oscillator is rising in the territory of the downtrend with the possible intention to move to the green zone. Let's wait for the resolution of the uncertainty when the US employment data comes out this evening.


    *The market analysis posted here is meant to increase your awareness, but not to give instructions to make a trade.


    Analysis are provided byInstaForex.


    Read More

  3. #1363
    Senior Member InstaForex Gertrude's Avatar
    Join Date
    Sep 2015
    Posts
    1,885
    Forex Analysis & Reviews: Technical Analysis of Daily Price Movements of CAD/JPY Commodity Currency Pairs, Monday February 06 2023.


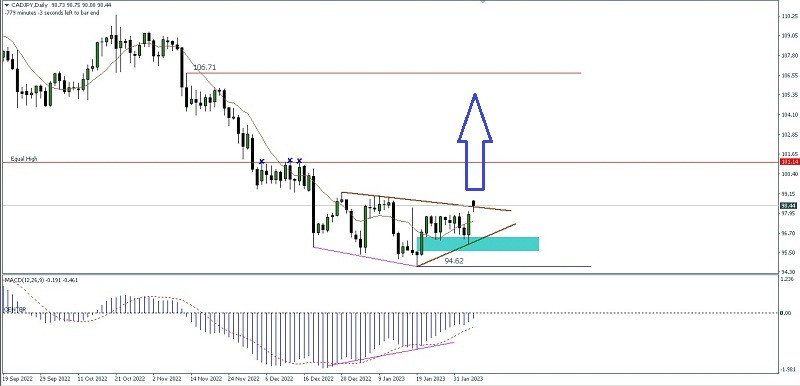
    With the success of the CAD/JPY Commodity currency pair breaking above its Penant pattern which was followed by a deviation from the MACD Histogram indicator with price movements that were also above the Moving Average movement, we can conclude that Buyers are starting to return to CAD/JPY which will make this commodity currency pair have the potential to appreciate and rally upwards in the next few days to test the equal high level (liquidity gathering place) at 101.14 and 105.71 will be the targets of both, but if on the way to these target levels there is one and another thing that makes this currency pair return to its original bias (Bearish), especially if it manages to break below the 95.30 level, the upward rally scenario described earlier will become invalid and cancel itself.

    *The market analysis posted here is meant to increase your awareness, but not to give instructions to make a trade.

    Analysis are provided by InstaForex.

    Read More
    Best regards, PR Manager
    Learn more about InstaForex Company at http://instaforex.com

  4. #1364
    Senior Member InstaForex Gertrude's Avatar
    Join Date
    Sep 2015
    Posts
    1,885
    Forex Analysis & Reviews: Forecast for EUR/USD on February 7, 2023

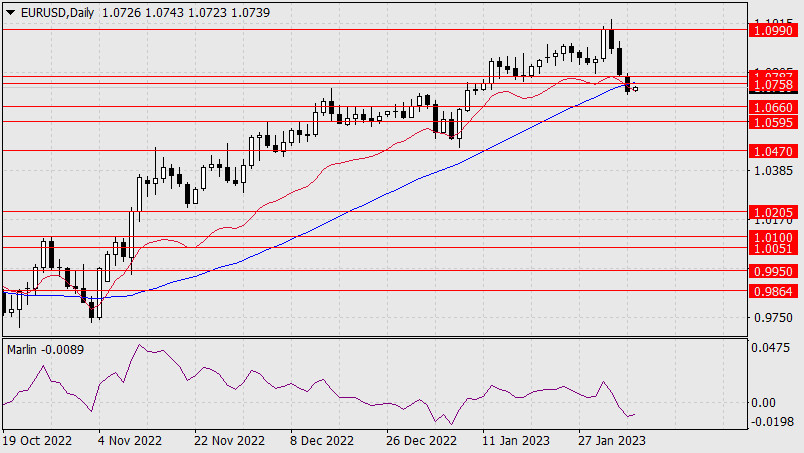
    Yesterday, the euro managed to overcome the support of the 1.0758/87 target range as well as the MACD line, which has already been embedded. Now the nearest target is 1.0660, followed by 1.0595. The range of these levels represents the consolidation of December.


    Traditionally, there is a correction after a sharp downtrend, afterwards, the pair will enter growth in the medium-term. It is possible for the pair to enter a bullish correction from the range of 1.0595-1.0660.


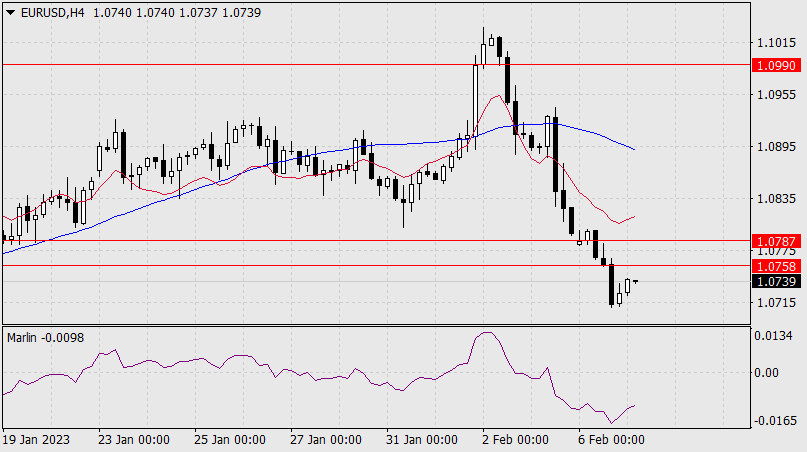
    On the four-hour chart, the price has settled under the lower limit of the 1.0758/87 range, the signal line of the Marlin oscillator slightly turned up, and this range will probably be tested. I expect EUR/USD to fall further.

    *The market analysis posted here is meant to increase your awareness, but not to give instructions to make a trade.

    Analysis are provided by InstaForex.

    Read More
    Best regards, PR Manager
    Learn more about InstaForex Company at http://instaforex.com

  5. #1365
    Senior Member InstaForex Gertrude's Avatar
    Join Date
    Sep 2015
    Posts
    1,885
    Forex Analysis & Reviews: Technical Analysis of Intraday Price Movements of USD/MXN currency pairs, Wednesday 08 February 2023.


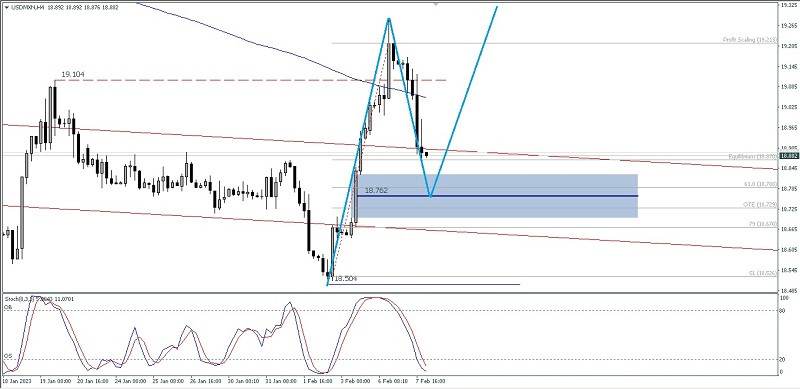
    After succesfully break above the level 19,104 and after that USD/MXN currency pairs halted by the upward movement by the Dynamic Resistance (MA 200). Now USD/MXN is falling back down to test the 18,762 level. If this level is able to withstand the downward trend of USD/MXN, this currency pair has the potential to rise again if during a downward correction. there was no significant decline that passed below the 18,672 level where if this level was not broken then USD/MXN would have the potential to rally again up to the 19,213-19,398 area level as the first target and the 19,639-19,900 area level as the second target.

    *The market analysis posted here is meant to increase your awareness, but not to give instructions to make a trade.

    Analysis are provided by InstaForex.

    Read More
    Best regards, PR Manager
    Learn more about InstaForex Company at http://instaforex.com

  6. #1366
    Senior Member InstaForex Gertrude's Avatar
    Join Date
    Sep 2015
    Posts
    1,885
    Forex Analysis & Reviews: USDJPY analysis for February 9th, 2023.


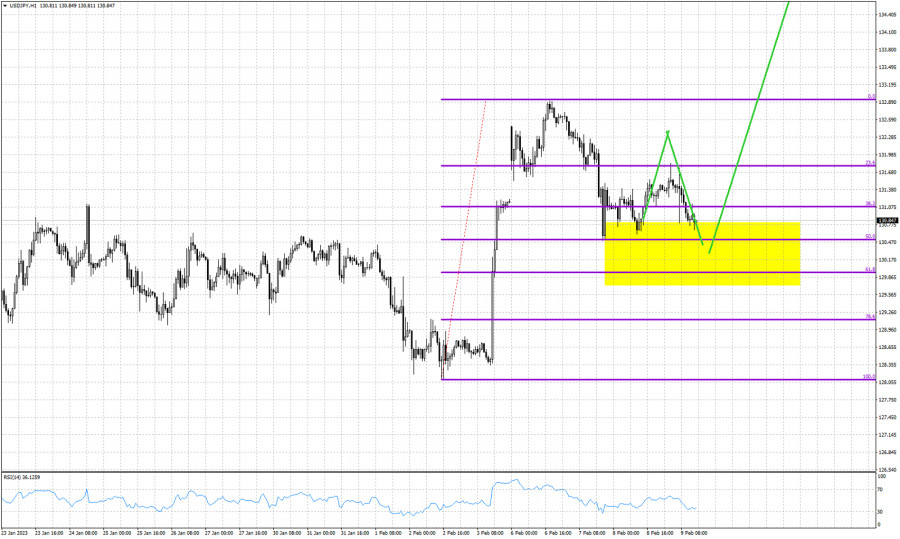
    Yellow rectangle- support area
    Green lines- expected path
    Violet lines- Fibonacci retracement levels

    USDJPY as expected has pulled back and closed the open gap from Monday's open. Price so far follows our expected price path towards 129.90-130.60 area where we expect to finish the counter trend move. Price is now testing the 50% Fibonacci retracement once again. This time expect to see a move below the 50% retracement towards the 61.8% level which is key support. We usually see trend reversals if price respects the 61.8% retracement. Because price formed 5 waves up from the 128 lows, I expect to see a retracement of this upward move with the formation of a higher low inside the yellow rectangle area.

    *The market analysis posted here is meant to increase your awareness, but not to give instructions to make a trade.

    Analysis are provided by InstaForex.

    Read More
    Best regards, PR Manager
    Learn more about InstaForex Company at http://instaforex.com

  7. #1367
    Senior Member InstaForex Gertrude's Avatar
    Join Date
    Sep 2015
    Posts
    1,885
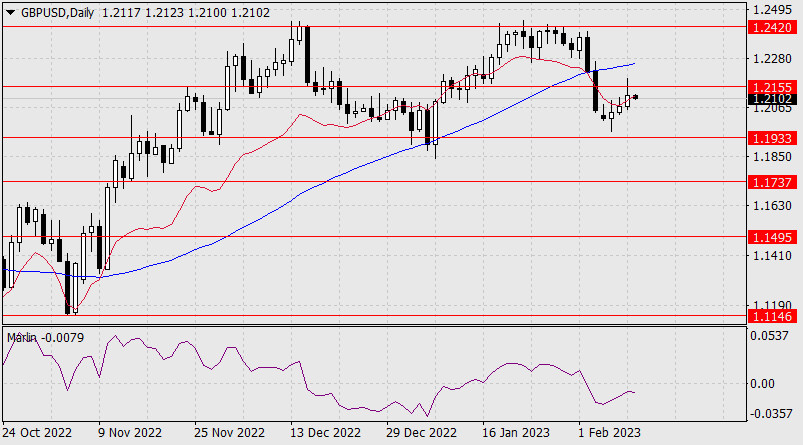
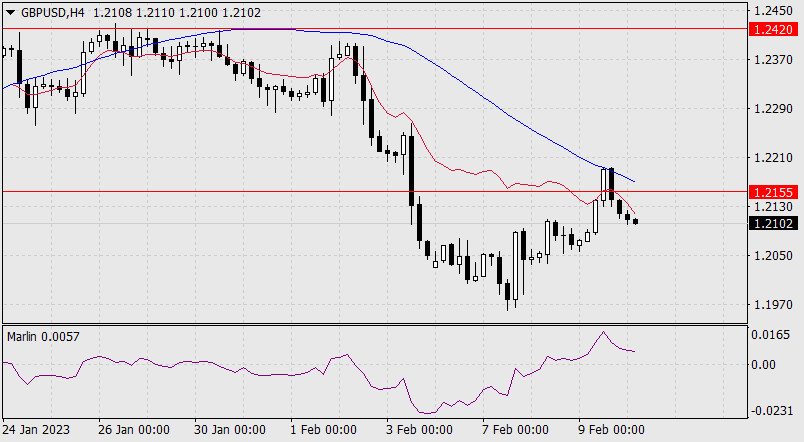
    Forex Analysis & Reviews: Forecast for GBP/USD on February 10, 2023

    My expectation that the British pound would reverse on Thursday did not materialize. On the contrary, the pound is up 50 pips. But the upper shadow is higher by 75 pips, which is a good sign of the reversal. The Fibonacci time zone tool had to be abandoned. Ideally, nothing has changed. I expect the pound to weaken along with other currencies because of the global strengthening of the dollar.


    The pound may even go ahead of the market today, as weaker economic data is expected for the UK. Q4 GDP is forecast to show zero growth, December GDP may show a decline of 0.3%, annual GDP is expected to decline to 0.4% from the previous 1.9%, December industrial production may show a decline of 0.2%, trade balance is expected to deteriorate to -16.4 billion from the previous -15.6 billion. On the daily chart, the upper shadow pierced the resistance of 1.2155, the Marlin oscillator turned down in the downtrend zone. The nearest bearish target is 1.1933. On the four-hour chart, the growth was stopped by the MACD indicator line. Now the price has settled below 1.2155 and under the red balance line. Marlin turned down. So, we are waiting for today's UK reports and the pound to fall.


    *The market analysis posted here is meant to increase your awareness, but not to give instructions to make a trade.

    Analysis are provided by InstaForex.

    Read More
    Best regards, PR Manager
    Learn more about InstaForex Company at http://instaforex.com

  8. #1368
    Senior Member InstaForex Gertrude's Avatar
    Join Date
    Sep 2015
    Posts
    1,885
    Forex Analysis & Reviews: Forecast for EUR/USD on February 13, 2023

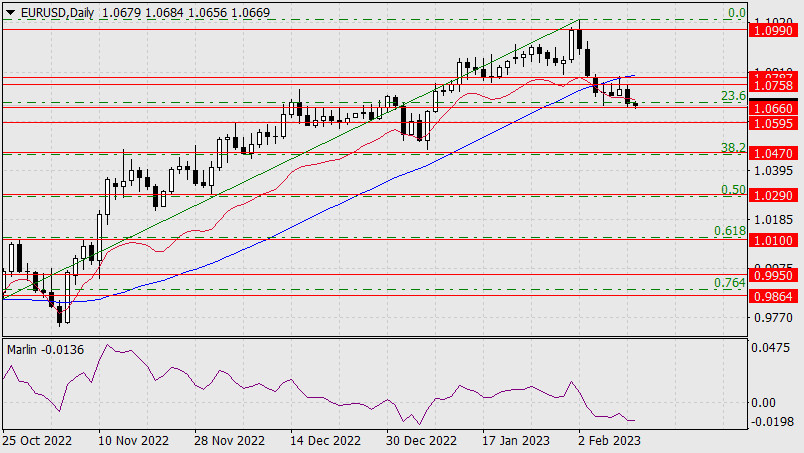
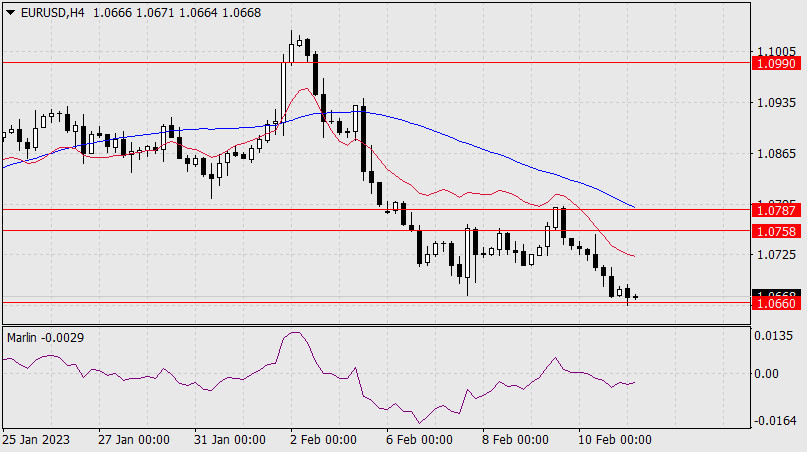
    The euro fell by 62 points on Friday. The price is very close to 1.0660, the upper limit of the consolidation range of December 16-26. Overcoming the support can push the price to 1.0595, it can fall further to the target level of 1.0470, the lows of June 22 and April 28, 2022. Also, this level is close to the 38% retracement of the entire growth since September 28.


    The price has overcome the support of the balance and MACD indicator lines, the Marlin oscillator is declining in the red zone - a blatant downtrend.


    On the four-hour chart, the price shows signs of consolidation before reaching the support of 1.0660, the Marlin has settled in the area of the downtrend. We can also see the price in preparation as it falls further.

    *The market analysis posted here is meant to increase your awareness, but not to give instructions to make a trade.

    Analysis are provided by InstaForex.

    Read More
    Best regards, PR Manager
    Learn more about InstaForex Company at http://instaforex.com

  9. #1369
    Senior Member InstaForex Gertrude's Avatar
    Join Date
    Sep 2015
    Posts
    1,885
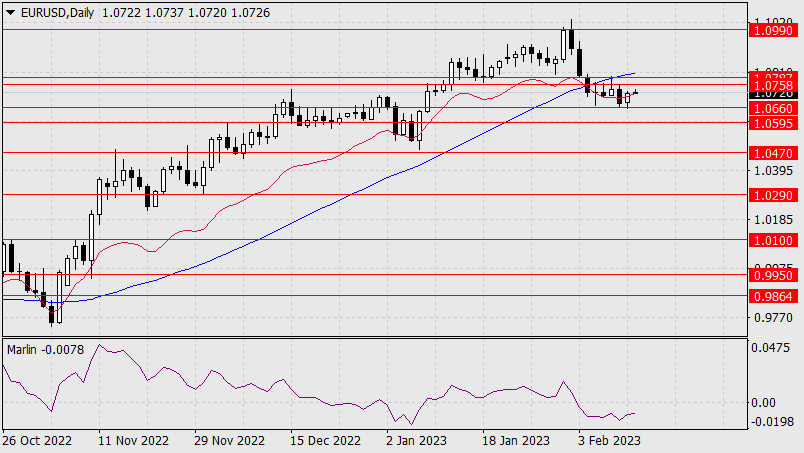
    Forex Analysis & Reviews: Forecast for EUR/USD on February 14, 2023

    The market was calm on Monday, without any upbeat news, the euro could not overcome the technical support at 1.0660, yesterday's growth was 45 pips. The euro continued to move sideways in the 1.0660-1.0758 range.


    The best thing that the euro can do for the bearish scenario is to pierce the upper limit of the 1.0758/87 range. If the euro settles above the MACD line (above 1.0820), the alternative option is for the price to rise to 1.0990. I expect the price to cross 1.0660 and fall further to 1.0595.


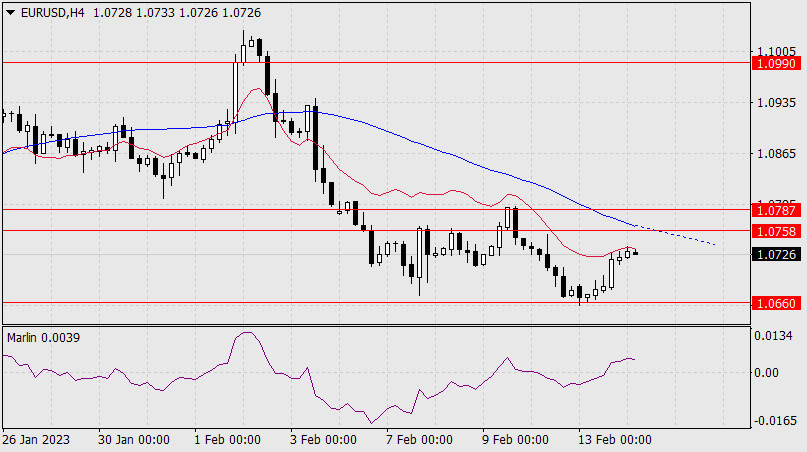
    On the four-hour chart, the signal line of the Marlin oscillator is in the green zone. This will help the price and if it doesn't overcome the nearest resistance, then it will linger in the sideways movement. At the moment, time is not on the euro's side, since the MACD line is getting closer to the price with each candle, and it increases the pressure.

    *The market analysis posted here is meant to increase your awareness, but not to give instructions to make a trade.

    Analysis are provided by InstaForex.

    Read More
    Best regards, PR Manager
    Learn more about InstaForex Company at http://instaforex.com

  10. #1370
    Senior Member InstaForex Gertrude's Avatar
    Join Date
    Sep 2015
    Posts
    1,885
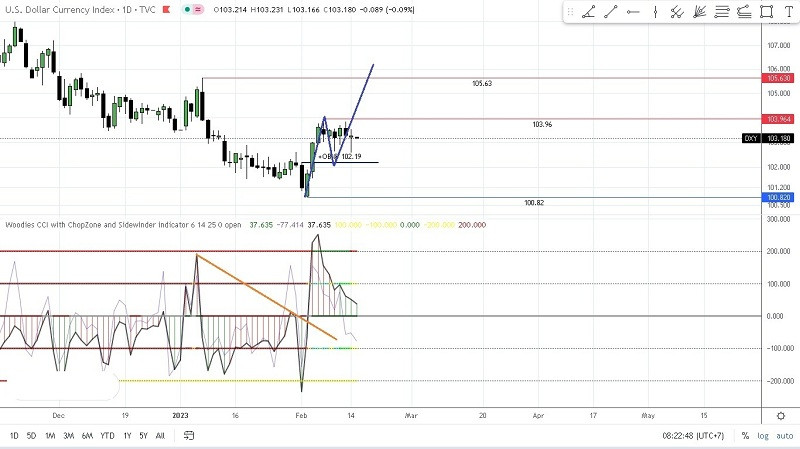
    Forex Analysis & Reviews: Technical Analysis of Daily Price Movement of USD Currency Index, Wednesday February 15 2023.


    On the daily chart of the USD Dollar Index, it can be seen that there was a trendline break (TLB) condition on the CCI (14) indicator which was previously in a bear condition where the Chop Zone (CZ) indicator (levels 100 & -100) was red but after that TLB and CCI move above level 0, so CZ changes color to cyan blue and now the CCI histogram (14) has turned green, followed by Sidewinder color (levels 200 & -200) changes color to yellow (volatile/Trending) and green (very volatile / trending) so that in the future USDX has the potential to be Bullish appreciated going up to the 103.96 level as the first target and the 105.63 level as the second target but before that it seems that USDX will be corrected down to test the 102.19 level and as long as this level is strong enough to hold back the pace correction and does not exceed the level of 100.82, USDX has the potential to strengthen again where this can be seen at CCI 914) is trying to form Zero Line Reject (ZLR) pattern.

    *The market analysis posted here is meant to increase your awareness, but not to give instructions to make a trade.

    Analysis are provided by InstaForex.

    Read More
    Best regards, PR Manager
    Learn more about InstaForex Company at http://instaforex.com

Page 137 of 165 FirstFirst ... 37 87 127 135 136 137 138 139 147 ... LastLast

Tags for this Thread

Bookmarks

Posting Permissions

  • You may not post new threads
  • You may not post replies
  • You may not post attachments
  • You may not edit your posts
  •