
 2Likes
 LinkBack URL
 About LinkBacks


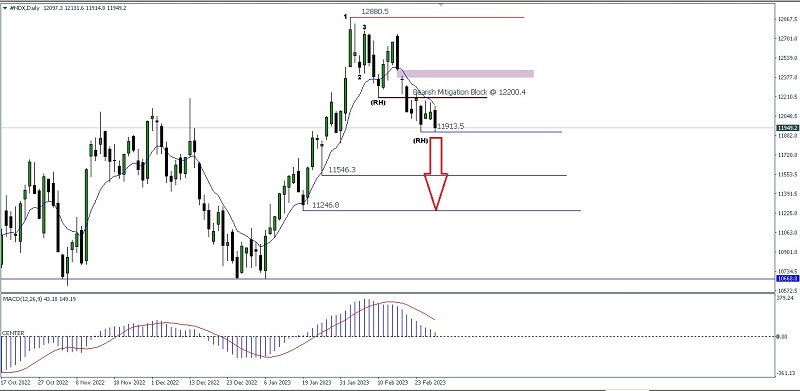
FOREX ANALYSIS & REVIEWS: TECHNICAL ANALYSIS OF DAILY PRICE MOVEMENT OF NASDAQ 100 INDEX, THURSDAY MARCH 02 2023.
Nasdaq 100 Index on the daily chart seems continue the decline and currently trying to break below its Bearish Ross Hook at the level 11913.5 where it is also confirmed by the price movement that moves below EMA 10 and MACD indicator which intersects downwards where this all shows that the momentum from #NDX is in a bearish condition so that if this (RH) level is successfully broken down then #NDX has the potential to continue its decline to the level of 11546.3 as the first target and if the momentum and volatility are also supportive then no It is impossible for the 11246.8 level to become the second target with a note that during the descent towards these target levels there was no significant upward correction, especially to break above the 12236.7 level because if this level is successfully penetrated upwards then the downward scenario described previously has the potential not to occur. realized.
(Disclaimer)
*The market analysis posted here is meant to increase your awareness, but not to give instructions to make a trade.
Analysis are provided by InstaForex.
Read More


 Reply With Quote


Bookmarks