
 6Likes
 LinkBack URL
 About LinkBacks


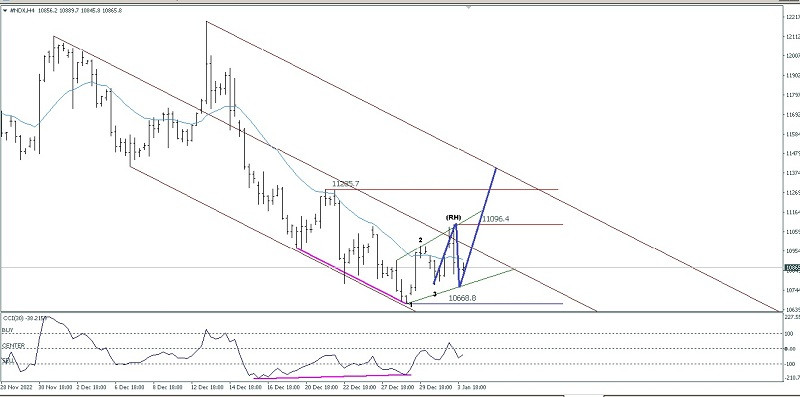
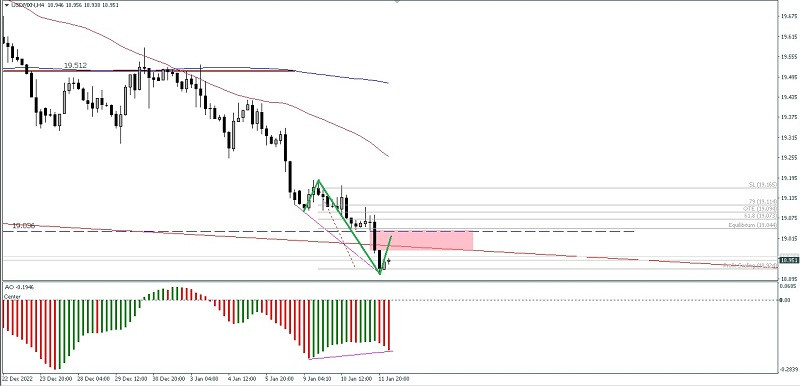
Forex Analysis & Reviews: Technical Analysis of Intraday Price Movements of Nasdaq 100 Index, Wednesday January 04 2023.
Nasdaq 100 Index on its 4 hour chart seems moving harmoniously inside Bearish Pitchfork Channel where this indicates that the Seller is still dominant in EUR/AUD but with the presence of deviations between price movements and the CCI indicator and the appearance of the Bullish 123 pattern followed by the appearance of the Ross Hook (RH) indicates that in the near future EUR/AUD will be corrected upwards where the Ross Hook (RH) level of 11096.4 will be the main target to be tested for this cross currency pair to be penetrated so that if this (RH) level is successfully broken above then the 11285.7 level will be the next target which will be tested by EUR/AUD but by because this upward correction causes an Ascending Broadening Wedge pattern to emerge, so please be careful. There will be a potential for EUR/AUD to continue the previous Bearish bias if suddenly EUR/AUD drops back down to past the 10668.8 level because if this level is successfully broken down, then the upward rally correction scenario described previously will become invalid and cancel by itself.
*The market analysis posted here is meant to increase your awareness, but not to give instructions to make a trade.
Analysis are provided by InstaForex.
Read More


 Reply With Quote


Bookmarks