Page 133 of 166 FirstFirst ... 33 83 123 131 132 133 134 135 143 ... LastLast
Results 1,321 to 1,330 of 1652

Wave Analysis by InstaForex

This is a discussion on Wave Analysis by InstaForex within the Analytics and News forums, part of the Trading Forum category; Forex Analysis & Reviews: Forecast for EUR/USD on December 2, 2022 In anticipation of today's US jobs data, on the ...


  1. #1321
    Senior Member InstaForex Gertrude's Avatar
    Join Date
    Sep 2015
    Posts
    1,885
    Forex Analysis & Reviews: Forecast for EUR/USD on December 2, 2022

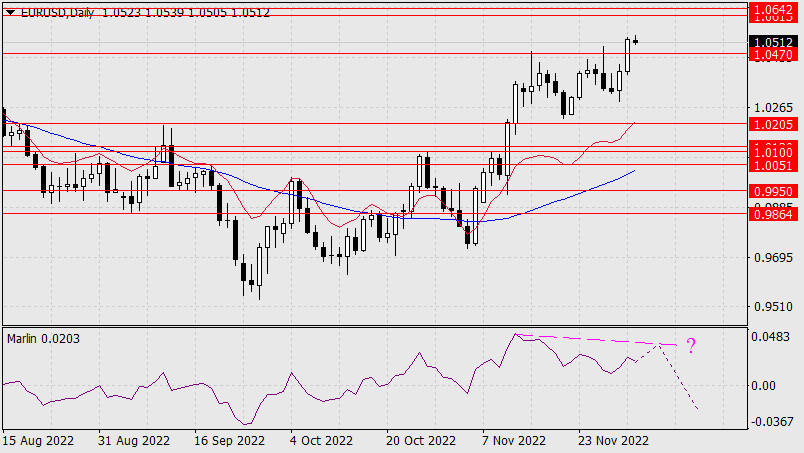
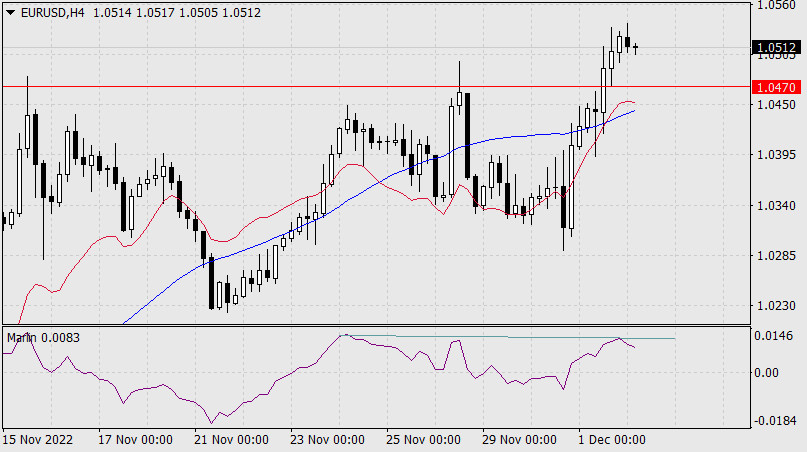
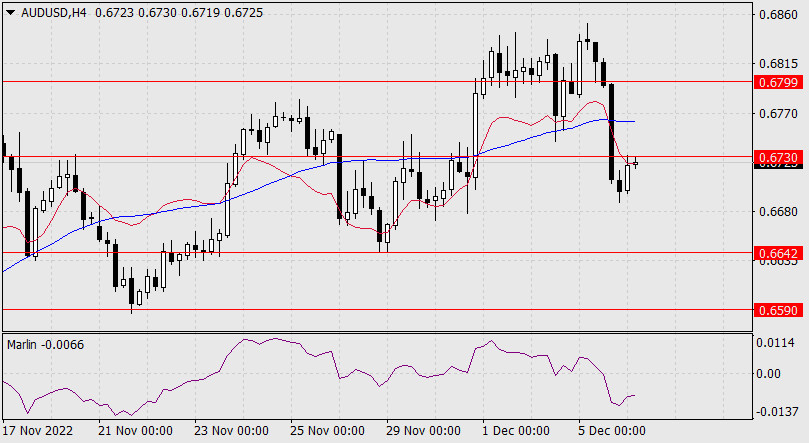
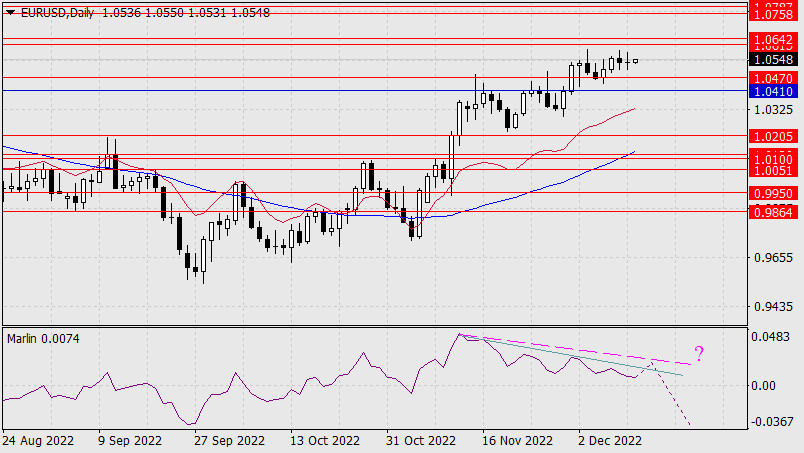
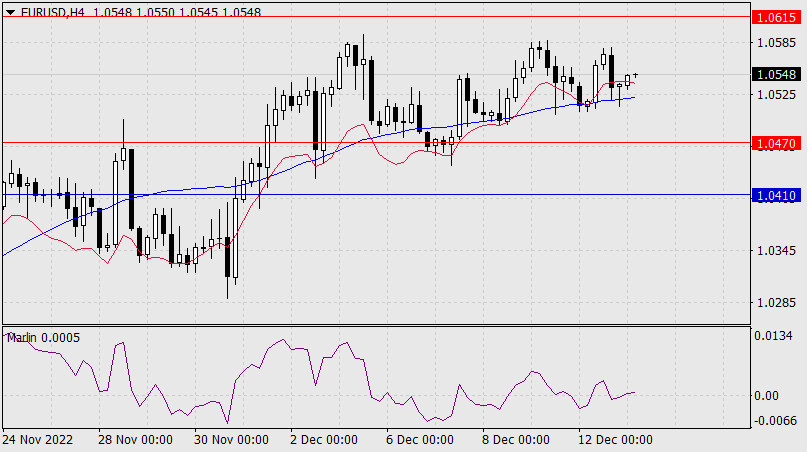
    In anticipation of today's US jobs data, on the back of Federal Reserve Chairman Jerome Powell's seemingly not obvious dovish speech, the euro rose 119 pips yesterday. The price crossed the target level of 1.0470, the peak of November 28, and is now heading to the target range of 1.0015/42. The range is defined by the highs of June and May. So far, the price is going with our scenario with forming a divergence when the target range is reached.


    On the four-hour chart, there is a sign that a double divergence is forming with the Marlin oscillator. In the current market sentiment, it may mean a pause in growth in anticipation of new important information. That will be the U.S. employment data for November. Forecast is 200,000 new jobs, compared to 261,000 in October.

    The improving dynamics of weekly unemployment claims and yesterday's drop of the ISM Manufacturing Employment subindex from 50.0 to 48.4 might be weaker than expected. Traders will be waiting for this situation to become clearer.


    Analysis are provided by InstaForex.

    Read More
    Best regards, PR Manager
    Learn more about InstaForex Company at http://instaforex.com

  2. #1322
    Senior Member InstaForex Gertrude's Avatar
    Join Date
    Sep 2015
    Posts
    1,885
    Forex Analysis & Reviews: Technical Analysis of Daily Price Movements of Crude Oil Commodity Assets, Monday, December 05 2022.


    On the daily chart, the Crude Oil commodity asset can be seen that Friday's bar has a Close that overlaps with the PL Dots so that it forms a Support/Block area at Friday's low to push up Crude Oil's movement on Monday Dec 05, 2022 as for Crude Oil on Monday is predicted to be pushed by market players to the Projection High area at the 81.57 level. If this level is successfully broke, then the 82.20 level which is the Sacrosanct Level / Halo will be the main target to be broke upwards as long as the 79.66 block area is not penetrated below.

    *The market analysis posted here is meant to increase your awareness, but not to give instructions to make a trade.

    Analysis are provided by InstaForex.

    Read More
    Best regards, PR Manager
    Learn more about InstaForex Company at http://instaforex.com

  3. #1323
    Senior Member InstaForex Gertrude's Avatar
    Join Date
    Sep 2015
    Posts
    1,885
    Forex Analysis & Reviews: Forecast for AUD/USD on December 6, 2022

    By the end of Monday the dollar index gained 0.78%, oil prices fell by 3.66% and the Australian dollar fell by 1.37%. The price overcame the support at 0.6730 and now it is trying to increase in today's Asian session, but without losing the opportunity to settle below the level.


    The price can reach the target support at 0.6642, in case it overcomes yesterday's low at 0.6688, in which case the signal line of the Marlin oscillator will break through the zero line and move into the territory of the downtrend. Divergence continues to exert its effect on the price.


    On the four-hour chart, the price settled under the MACD line and under the level of 0.6730. Also, the Marlin oscillator settled in the negative territory. By cumulative circumstances of both charts, the bears have advantages. We wait for things to progress and AUD to reach the target support at 0.6642.

    *The market analysis posted here is meant to increase your awareness, but not to give instructions to make a trade.

    Analysis are provided by InstaForex.

    Read More
    Best regards, PR Manager
    Learn more about InstaForex Company at http://instaforex.com

  4. #1324
    Senior Member InstaForex Gertrude's Avatar
    Join Date
    Sep 2015
    Posts
    1,885
    Forex Analysis & Reviews: Technical Analysis of Daily Price Movement of the GBP/AUD Cross Currency Pair Wednesday, December 07, 2022.


    With the GBP/AUD price movement on the daily chart still moving above its 50 MA and the formation of the Bullish 123 pattern followed by Ross Hook (RH) it can be seen that buyers are still dominating this cross currency pair but it seems that in the near future it will be corrected slightly to the level 1.7916 but please pay attention as long as the downward correction does not exceed the 1.7700 level, then you can be sure that GBP/AUD is still in a bullish condition and will try to test the 1.8256 level. (Disclaimer)

    *The market analysis posted here is meant to increase your awareness, but not to give instructions to make a trade.

    Analysis are provided by InstaForex.

    Read More
    Best regards, PR Manager
    Learn more about InstaForex Company at http://instaforex.com

  5. #1325
    Senior Member InstaForex Gertrude's Avatar
    Join Date
    Sep 2015
    Posts
    1,885
    Forex Analysis & Reviews: Trading Signal for GOLD (XAU/USD) on December 08-09, 2022: buy above $1,775-1,781 (+1/8 Murray - uptrend channel)


    XAU/USD is trading around 1,782, above the 21 SMA showing a bullish bias. It is likely that if gold consolidates above this area, it could reach the zone of 1,803 and even reach +2/8 Murray located in 1,812.

    Investors are worried as Vladimir Putin said the threat of nuclear war is growing, suggesting they would use nuclear weapons in response to an attack on his country. This news could increase risk aversion and investors could take refuge in gold. hence, the price could reach levels of 1,850, even quickly climbing as high as the landmark level of 1,900.

    Risk aversion could increase, causing investors to be very cautious. This is due to negative data from China, raising concerns about a global recession. This assures investors to take refuge in gold and the price could increase only if it consolidates above the psychological level of 1,800 -1,812.

    Yesterday in the American session, gold quickly rose above the uptrend channel, breaking the 21 SMA (1,780) and reaching the swing high of 1,788.06.

    The asset is currently consolidating above the key level of 1,781 (21 SMA), suggesting that if it settles above this area, the price could resume the bullish cycle in the next few hours.

    In the next few hours, we expect XAU/USD to trade above 1,781 and reach the resistance of 1,803 and even the high of Dec 5 at 1,810. On the other hand, in case of a technical bounce around the uptrend channel formed since November 22, we will have an opportunity to buy around 1,775.

    A close on the 4-hour chart below 1,770 and a sharp break of the uptrend channel are critical to trigger further declines in gold. The metal could quickly reach the 8/8 Murray (1,750) and even the 200 EMA located at 1,736.

    Our trading plan for the next few hours is to buy gold above 1,781 or in case of a technical bounce around 1,775, with targets at 1,803 and 1,812. *The market analysis posted here is meant to increase your awareness, but not to give instructions to make a trade.

    Analysis are provided by InstaForex.

    Read More
    Best regards, PR Manager
    Learn more about InstaForex Company at http://instaforex.com

  6. #1326
    Senior Member InstaForex Gertrude's Avatar
    Join Date
    Sep 2015
    Posts
    1,885
    Forex Analysis & Reviews: Technical Analysis of GBP/USD for December 9, 2022

    Technical Market Outlook: The GBP/USD pair has been seen bouncing up from the technical support located at 1.2106 and is moving closer to the swing high located at 1.2343. The momentum remains strong and positive which supports the short-term bullish outlook for GBP. The nearest technical support is still seen at 1.2106, so in a case of an unexpected breakout lower, the next target for bears is seen at 1.1897 (30th November low). Also, please notice the Bearish Divergence between the price and the momentum indicator that might have an impact on the next bearish movement.


    Weekly Pivot Points:
    WR3 - 1.24283
    WR2 - 1.23713
    WR1 - 1.23415
    Weekly Pivot - 1.23143
    WS1 - 1.22845
    WS2 - 1.22573
    WS3 - 1.22003

    Trading Outlook:
    The bulls are temporary in control of the market and the 50% Fibonacci retracement of the last big wave down located at 1.2293 had been tested, so a down trend resumption is possible. On the other hand, the level of 1.0351 has not been tested since 1985, so the down trend is strong. In order to terminate the down trend, bulls need to close the weekly candle above the level of 1.2275 (swing high from August 10th).

    *The market analysis posted here is meant to increase your awareness, but not to give instructions to make a trade.

    Analysis are provided by InstaForex.

    Read More
    Best regards, PR Manager
    Learn more about InstaForex Company at http://instaforex.com

  7. #1327
    Senior Member InstaForex Gertrude's Avatar
    Join Date
    Sep 2015
    Posts
    1,885
    Forex Analysis & Reviews: Technical Analysis of Daily Price Movement of Major Currency Pairs GBP/USD, Monday, December 12 2022.


    On the daily chart the main GBP/USD currency pair is starting to show signs of saturation over the rally that occurred over the previous few days, as reflected in several things:

    1. 1.2296 is difficult to break upwards
    2. The appearance of the Bearish = Rising Wedge pattern.
    3. Formation of a Bearish pattern 123.
    4. The appearance of Bearish Wiseman 1 & 2 signals.

    Therefore, in the next few days, as long as Cable does not reverse its rally up above the 1.2344 level, this major currency pair still has the potential to depreciate to the 1.2045 level as its main target and if the decline has quite high volatility then it is possible that the 1.1777 level will become next target to go to.

    *The market analysis posted here is meant to increase your awareness, but not to give instructions to make a trade.

    Analysis are provided by InstaForex.

    Read More
    Best regards, PR Manager
    Learn more about InstaForex Company at http://instaforex.com

  8. #1328
    Senior Member InstaForex Gertrude's Avatar
    Join Date
    Sep 2015
    Posts
    1,885
    Forex Analysis & Reviews: Forecast for EUR/USD on December 13, 2022

    Investors raise their expectations this week, in which several central banks meetings (Federal Reserve, European Central Bank, Bank of England) are held, given the ongoing divergence between central banks' monetary policies. The Fed will become softer, while the ECB will be more hawkish. Formally, the forecast for a rate hike by all central banks is the same - 0.50%, but there has been so much talk about a surprise from the ECB that a 0.75% hike has become a forecast rather than a surprise. And that's why the euro closed Monday at the opening level despite the decline of other counter-dollar currencies.


    This morning, the price is trying to rise. Today's main event will be the US inflation report for November. CPI is expected to decline from 7.7% y/y to 7.3% y/y. The euro has a chance to reach the target range of 1.0615/42. If the divergence in the sentiment of the central banks is really strong, the euro may go higher, to the range of 1.0758/87 (highs in May and June).

    On the four-hour chart, the price failed to fall under support of the MACD line. The last reversal from it occurred this morning. The Marlin oscillator is shifting to the upside. We expect the price to reach the first target range of 1.0615/42.


    The market analysis posted here is meant to increase your awareness, but not to give instructions to make a trade.

    Analysis are provided by InstaForex.

    Read More
    Best regards, PR Manager
    Learn more about InstaForex Company at http://instaforex.com

  9. #1329
    Senior Member InstaForex Gertrude's Avatar
    Join Date
    Sep 2015
    Posts
    1,885
    Forex Analysis & Reviews: Technical Analysis of Intraday Price Movement of Nasdaq 100, Thursday December 15, 2022.


    Although on its 4 hour chart Nasdaq 100 index seems move in a ranging condition but with the appearance of:
    1. The deviation between price movement with CCI indicator.
    2. The appearance of Bearish 123 pattern.
    3. Followed by the appearance of Ross Hook (RH).

    Based on three things above then in a nearest term #NDX has a potential to try to go down to test the Bearish Ross Hook level at 11608.9 if this level is successfully broken then the next level to go to is 11410.1 but if on the way to these levels there is a sudden upward correction to pass the 12007.9 level then the scenario of a decline has been described earlier will cancel by itself.

    (Disclaimer)
    *The market analysis posted here is meant to increase your awareness, but not to give instructions to make a trade.

    Analysis are provided by InstaForex.

    Read More
    Best regards, PR Manager
    Learn more about InstaForex Company at http://instaforex.com

  10. #1330
    Senior Member InstaForex Gertrude's Avatar
    Join Date
    Sep 2015
    Posts
    1,885
    Forex Analysis & Reviews: Trading Signal for GOLD (XAU/USD) on December 16-19, 2022: sell below $1,794 (5/8 Murray - 21 SMA)


    Early in the European session, gold (XAU/USD) is trading around 1,781, bouncing after hitting the low at 1,773.67.

    XAU/USD is trading below the uptrend channel and below the 21 SMA (1.795). The 4-hour chart shows further downside potential. The gold price is trading in the area of strong bearish pressure. If the price consolidates below of 1,790, it could reach the level of 200 EMA around 1,754.

    Since its maximum reached at 1,824 on Tuesday, gold has lost more than $50, so this weekly drop could be a sign of a probable change in trend in the short term.

    Gold is expected to continue its bounce in the next few hours and can reach the area of 1,790 - 1,795. Around this level, there will be a clear signal to sell with targets at 1,781-1,755.

    In case the bearish pressure persists, XAU/USD is expected to trade below the 5/8 Murray located at 1,781 and may continue to decline in the coming days until it reaches the 4/8 Murray area around 1,750.

    Our trading plan is to sell gold below 1,795, targeting 1,780 at 1,754. The eagle indicator is giving a negative signal which supports our bearish strategy.

    *The market analysis posted here is meant to increase your awareness, but not to give instructions to make a trade.

    Analysis are provided by InstaForex.

    Read More
    Best regards, PR Manager
    Learn more about InstaForex Company at http://instaforex.com

Page 133 of 166 FirstFirst ... 33 83 123 131 132 133 134 135 143 ... LastLast

Tags for this Thread

Bookmarks

Posting Permissions

  • You may not post new threads
  • You may not post replies
  • You may not post attachments
  • You may not edit your posts
  •