
 6Likes
 LinkBack URL
 About LinkBacks


Talking Points:
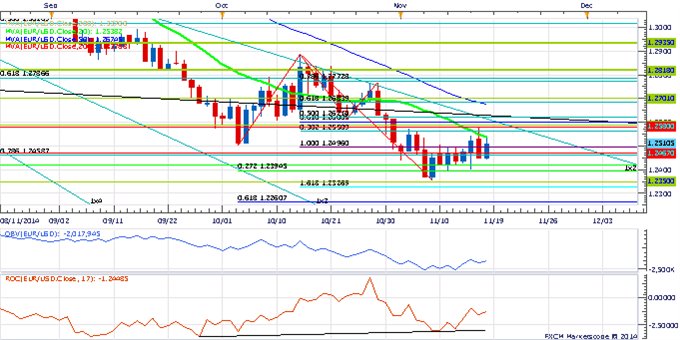
- US Dollar Poised to Extend Gains After Break of Resistance
- S&P 500 Clears September Top, Sets Another Record High
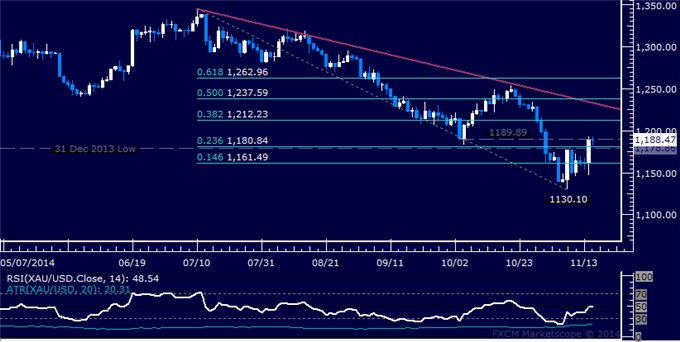
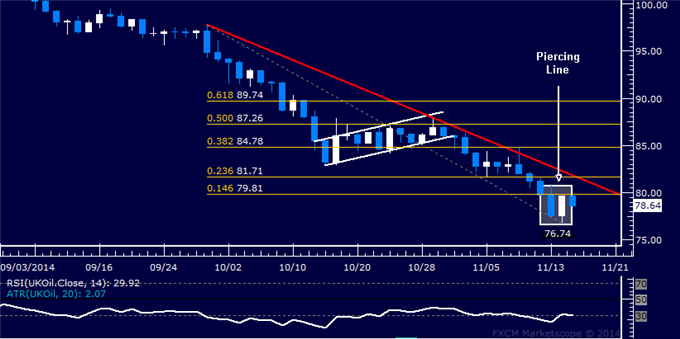
- Crude Oil Digesting Losses, Gold Drops Most in 11 Months
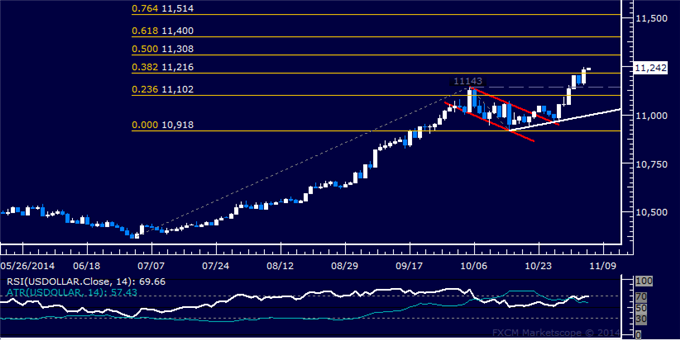
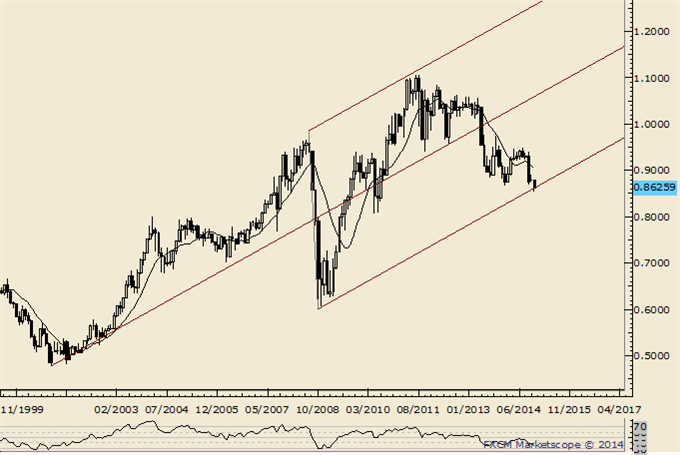
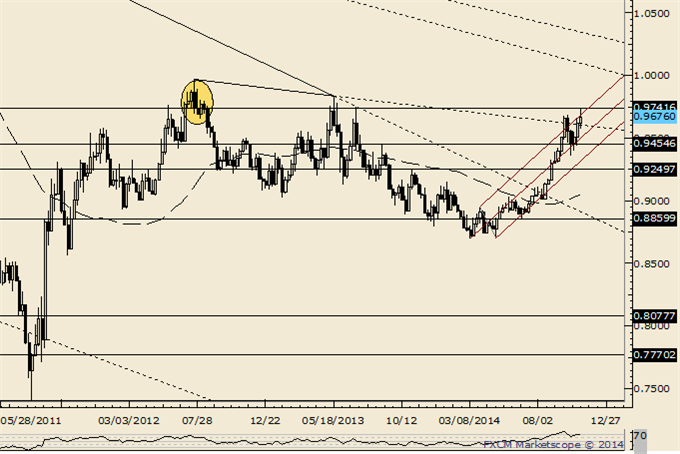
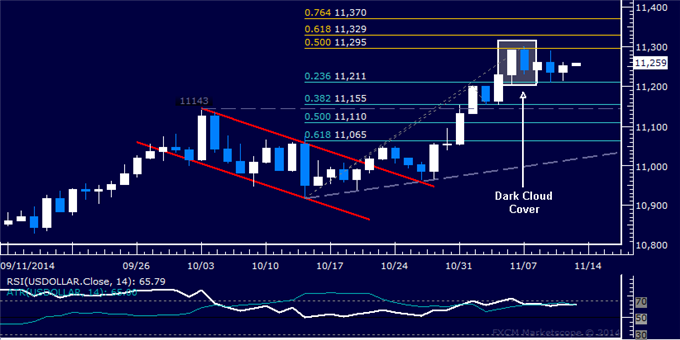
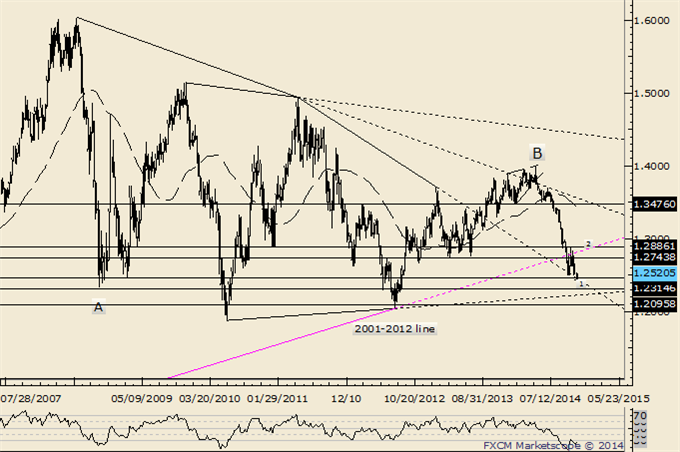
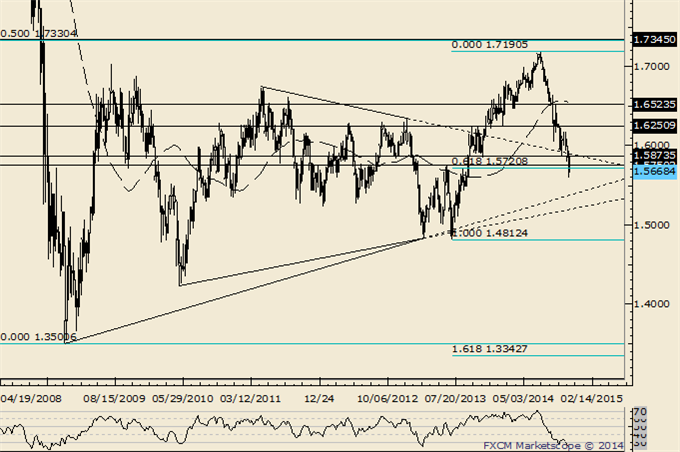
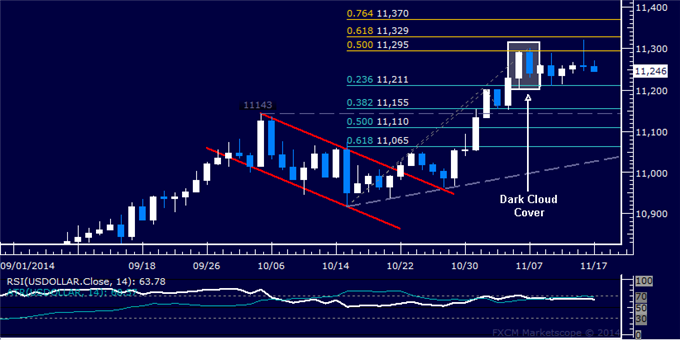
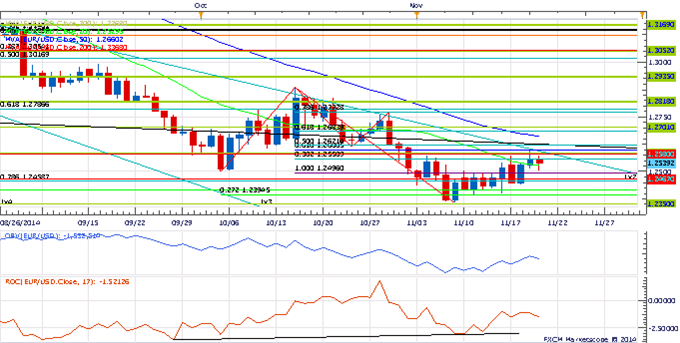
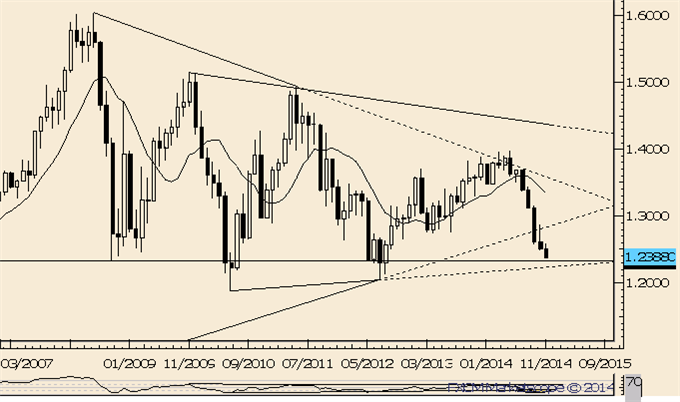
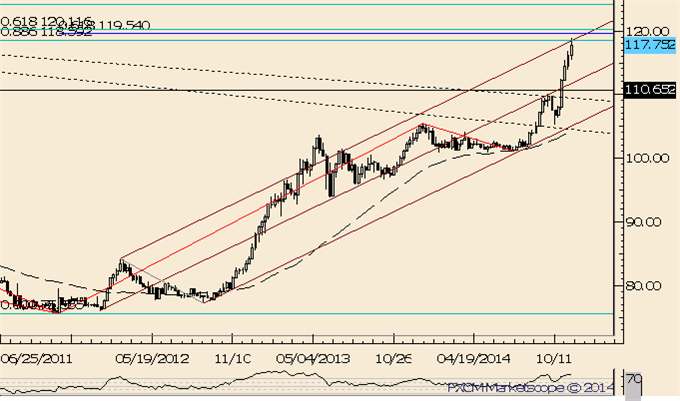
US DOLLAR TECHNICAL ANALYSIS – Prices look poised to extend its advance after prices cleared yet another technical barrier. A daily close above the 50% Fibonacci expansion at 11308 exposes the 61.8% level at 11400. Alternatively, a turn below the 38.2% Fib at 11216 opens the door for a challenge of the 11102-43 area marked by the October 3 high and the 23.6% expansion.
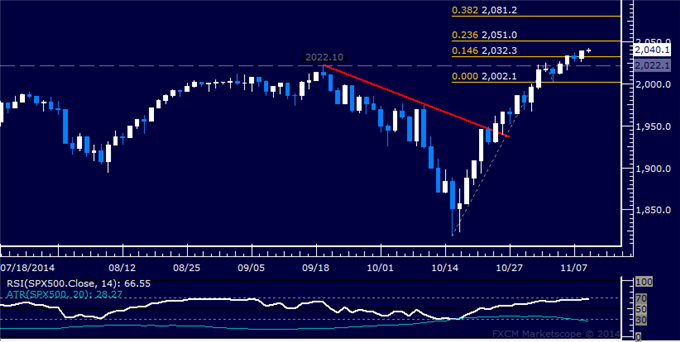
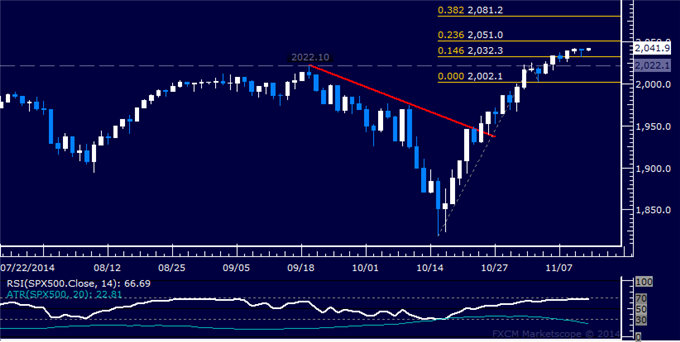
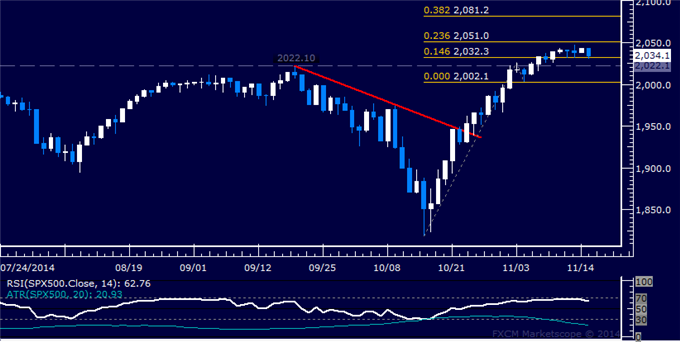
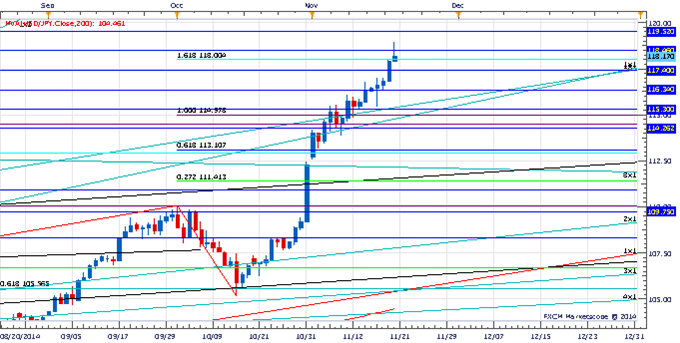
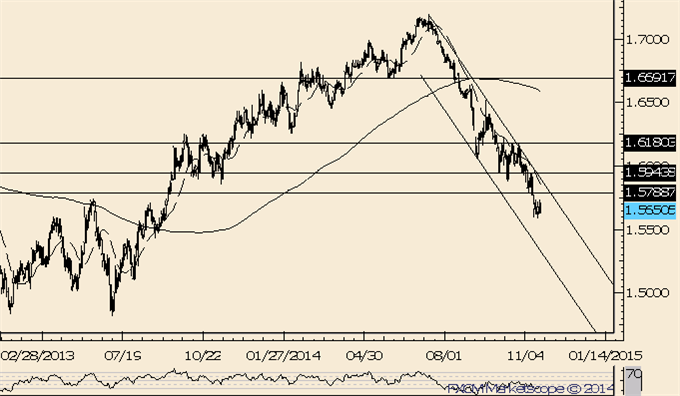
S&P 500 TECHNICAL ANALYSIS – Prices overcome September’s top at 2022.10, setting a new record high. Near-term resistance is now at 2032.30, the 14.6% Fibonacci expansion, with a break above that on a daily closing basis exposing the 23.6% level at 2051.00. Alternatively, a reversal back below 2022.10 sees support at 2002.10, the November 4 low.
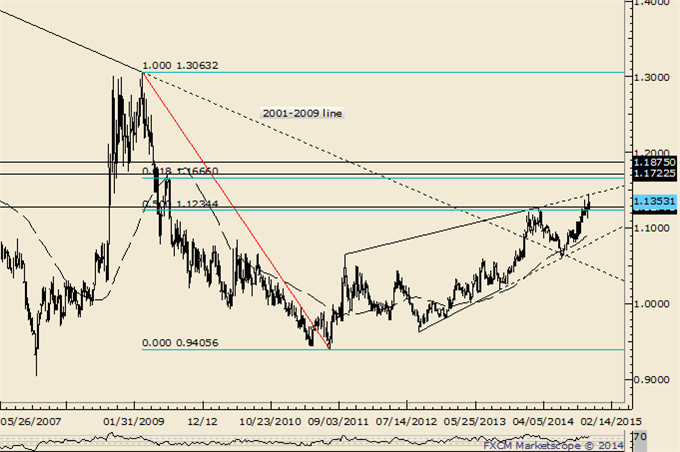
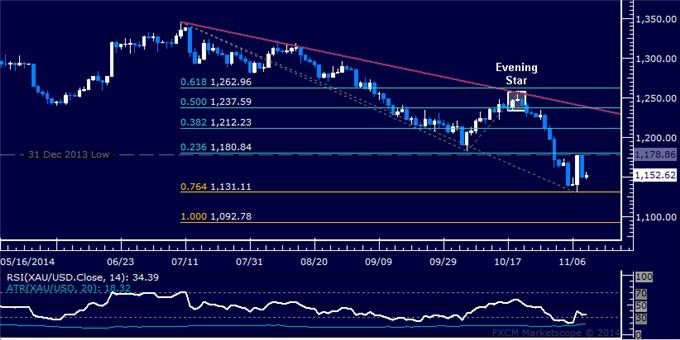
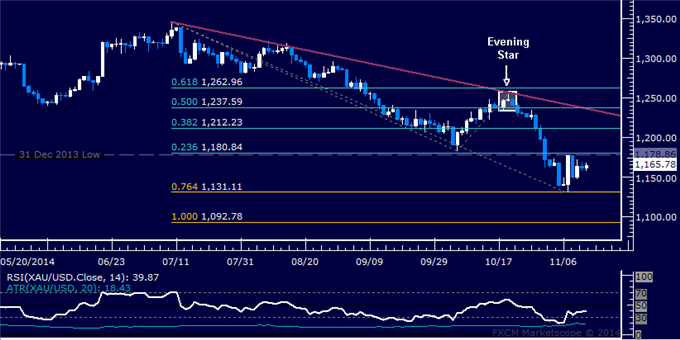
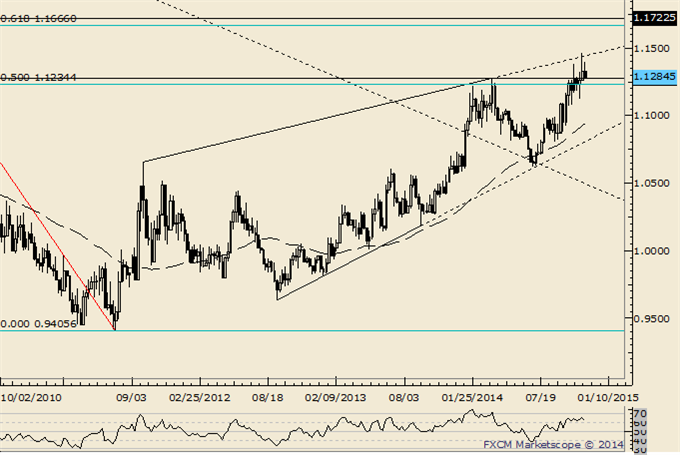
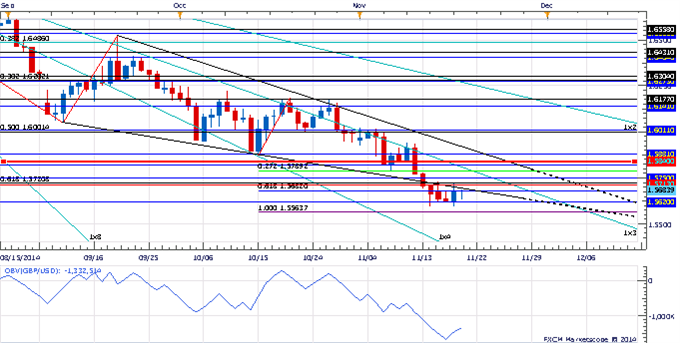
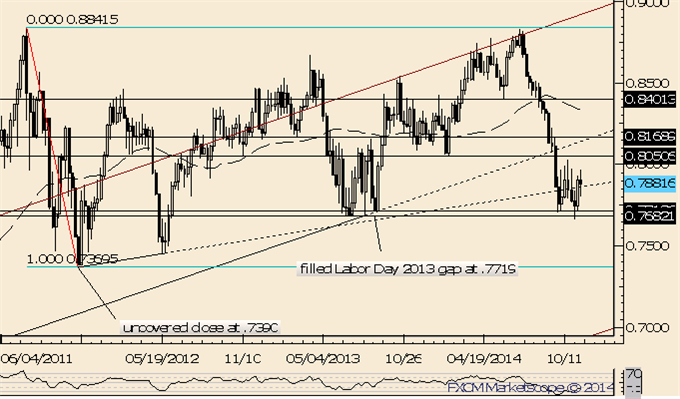
GOLD TECHNICAL ANALYSIS – Prices turned lower as expected after putting in a bearish Evening Star candlestick pattern. A daily close below the 76.4% Fibonacci expansion at 1131.11 exposes the 100% level at 1092.78. Alternatively, a reversal back above the 61.8% Fib at 1154.82 aims for the 1173.99-78.86 area (December 2013 low, 50% expansion).

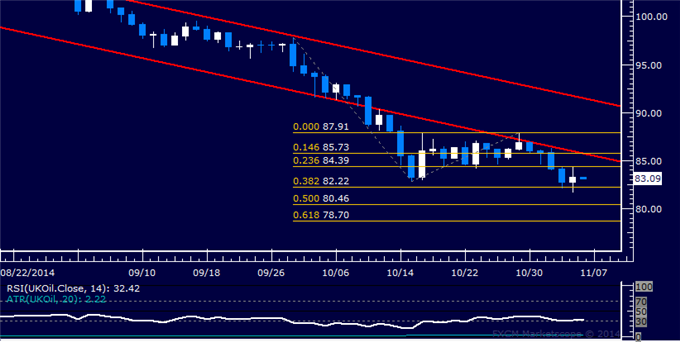
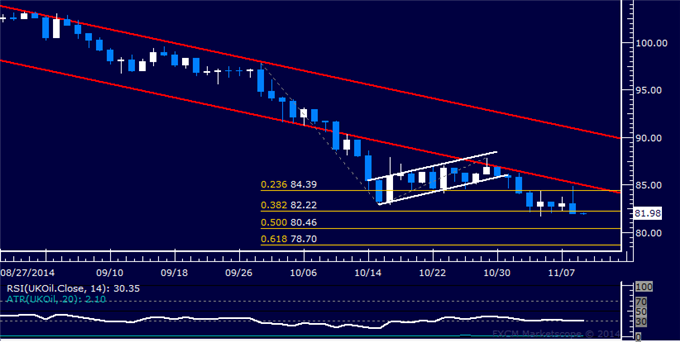
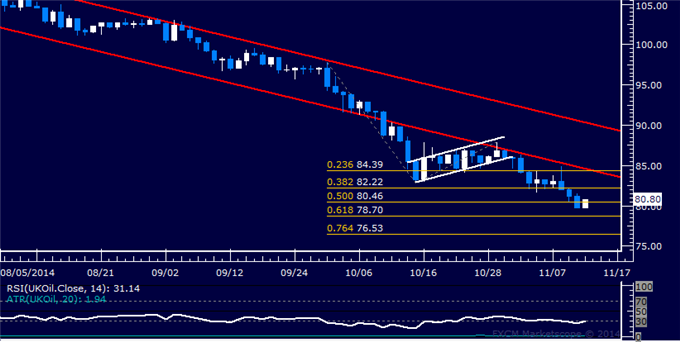
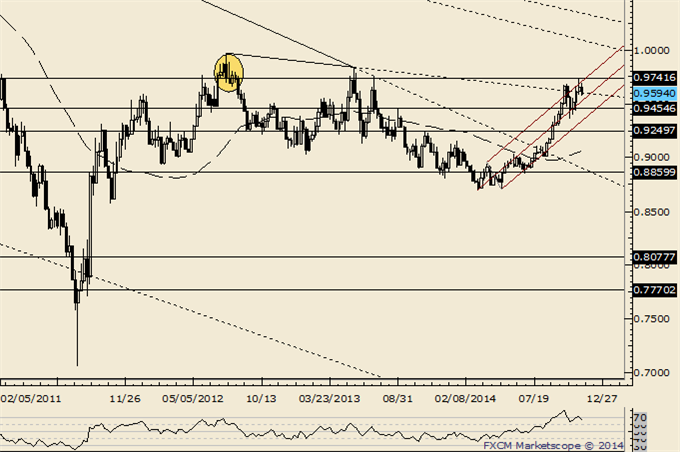
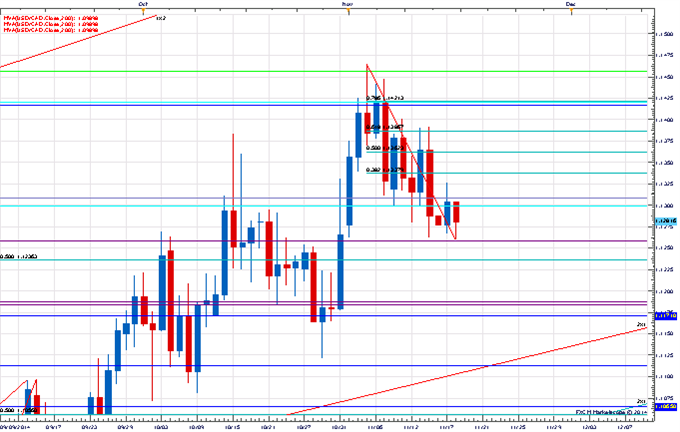
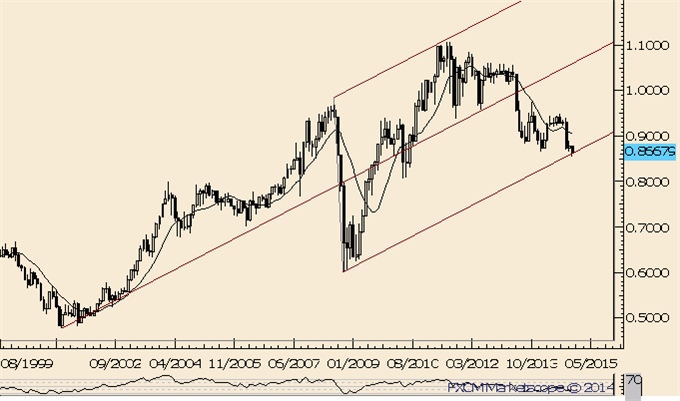
CRUDE OIL TECHNICAL ANALYSIS – Prices paused to digest losses after touching a four-year low. A daily close below the 38.2% Fibonacci expansion at 82.22 targets the 50% level at 80.46. Alternatively, a reversal above the 23.6% Fib at 84.39 aims for the intersection of the 14.6% expansion and channel floor support-turned-resistance at 85.73.
--- Written by Ilya Spivak, Currency Strategist for DailyFX.com
More...


 Reply With Quote


Bookmarks