
 LinkBack URL
 About LinkBacks


Talking Points:
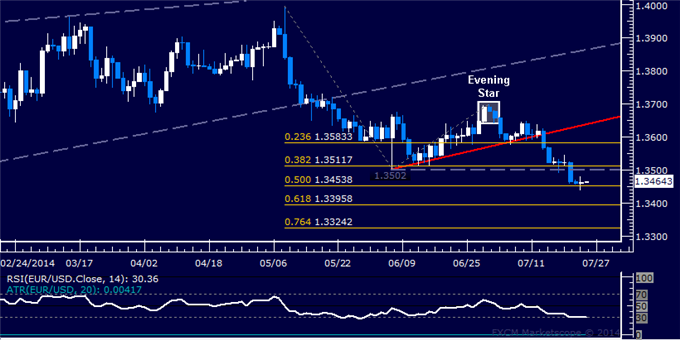
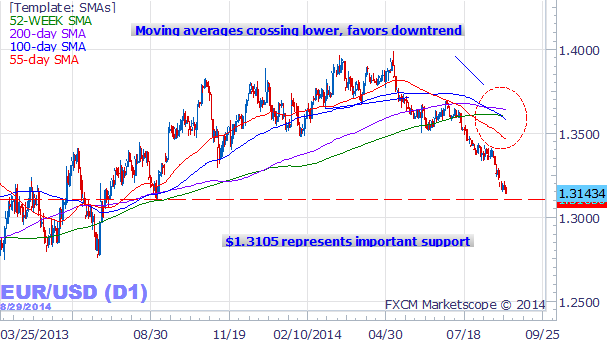
- EUR/USD Technical Strategy: Short at 1.3644
- Support: 1.3454, 1.3396, 1.3324
- Resistance:1.3502-12, 1.3583, 1.3637
The Euro declined against the US Dollar as expected after prices put in a bearish Evening Star candlestick pattern. A daily close below support at 1.3454, the 50% Fibonacci expansion, clears the way for a decline to the 61.8% level at 1.3396. Alternatively, reversal back above the 1.3502-12 area, marked by the 38.2% Fib and the June 5 low, opens the door for another challenge of the 23.6% expansion at 1.3583.
--- Written by Ilya Spivak, Currency Strategist for DailyFX.com
More...


 Reply With Quote


Bookmarks