
 1Likes
 LinkBack URL
 About LinkBacks


Talking Points
- USD/JPY Technical Strategy: Shorts Preferred
- Harami CandlestickPattern Awaiting Confirmation
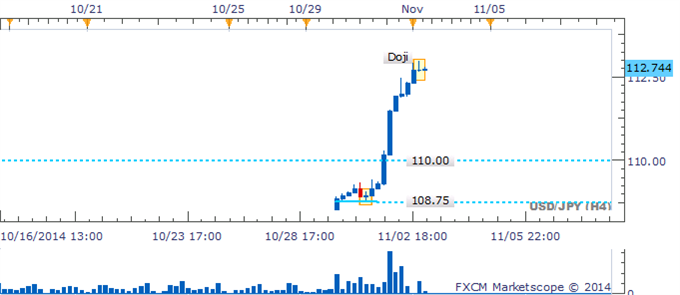
- Dojis On H4Suggests Some Reluctance Near 107
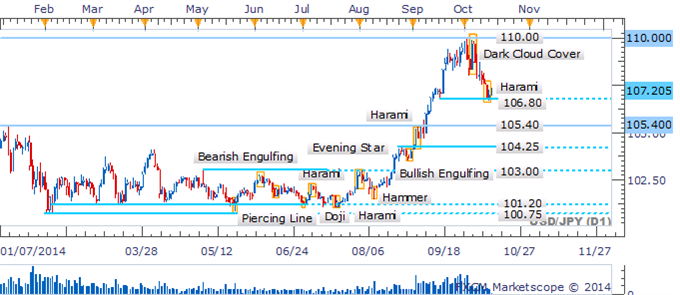
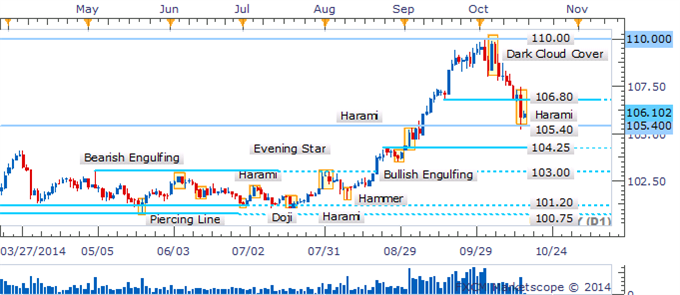
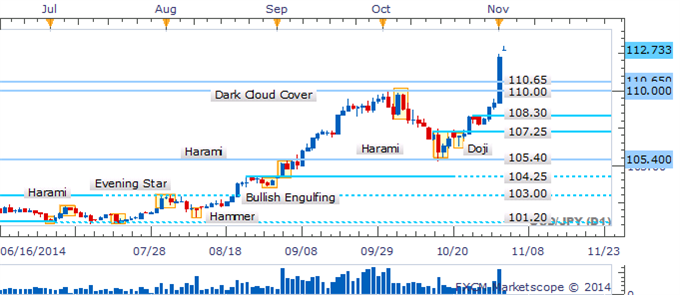
USD/JPY has bounced off the critical 106.80 floor leaving a Harami formation in its wake. Critically, the key reversal pattern awaits confirmation from a successive up-day to be validated. At this stage a sustained recovery may be challenging given the congestion between current levels and the recent peak at 110. In the alternate scenario a pullback below the 106.80 floor would open the next leg lower to 105.40
Harami Emerges Near 106.80 Barrier
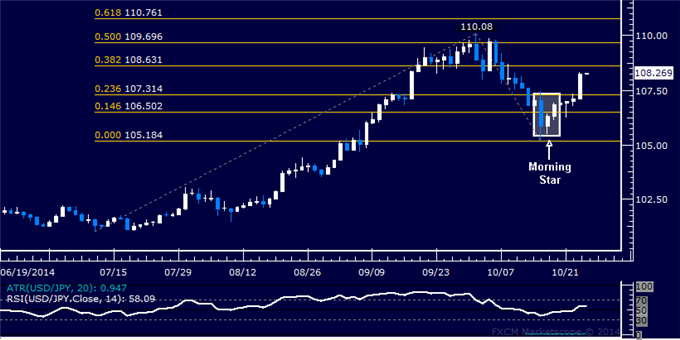
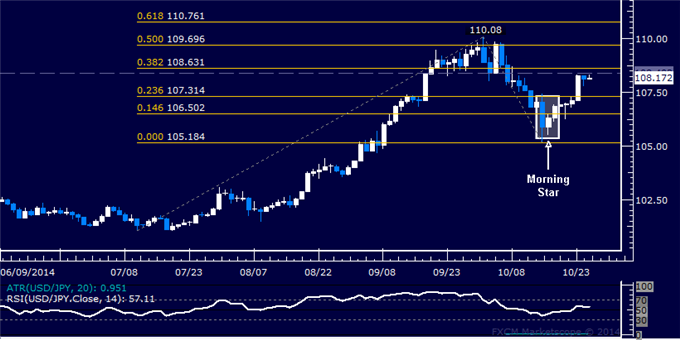
A parade of short body candles and Doji formations on the four hour chart suggest hesitation from traders near the 106.80 floor. This does little to inspire confidence in the potential for a recovery over the session ahead. Sellers are likely to return near the 107.50 ceiling.
Dojis Signal Reluctance Within Intraday Range
By David de Ferranti, Currency Analyst, DailyFX
More...


 Reply With Quote


Bookmarks