
 1Likes
 LinkBack URL
 About LinkBacks


Forex: USD/JPY Technical Analysis
Talking Points:
- USD/JPY Technical Strategy: Flat
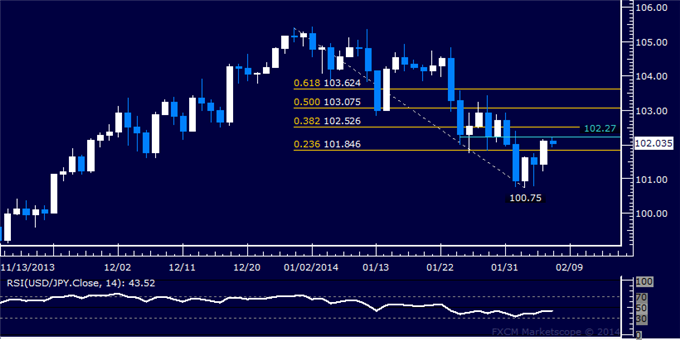
- Support: 101.85 (23.6% Fib ret.), 100.75 (Feb 2 low)
- Resistance: 102.27 (horizontal pivot), 102.53 (38.2% Fib ret.)
The US Dollar turned higher anew against the Japanese Yen, breaking above the 23.6% Fibonacci expansion at 101.85 to expose a support-turned-resistance shelf at 102.27. A further beyond this boundary targets the 38.2% level at 102.53. Alternatively, a reversal back below 101.85 on a daily closing basis exposes the February 4 low at 100.75.
Close proximity of near-term up- and downside technical barriers argues against taking a trade at the moment from a risk/reward perspective. Furthermore, The Yen remains highly sensitive to churn in risk appetite trends, making the currency’s crosses vulnerable to sharp volatility as the upcoming US Employment report comes across the wires. We will opt to stay aside for now.
--- Written by Ilya Spivak, Currency Strategist for DailyFX.com
More...


 Reply With Quote


Bookmarks