Page 2 of 29 FirstFirst 1 2 3 4 12 ... LastLast
Results 11 to 20 of 283

USDJPY and EURUSD Technical Analysis

This is a discussion on USDJPY and EURUSD Technical Analysis within the Forex Trading forums, part of the Trading Forum category; Talking Points USD/JPY Technical Strategy: Longs preferred on breakout Dojis on both the daily and four hourly charts suggest indecision ...


  1. #11
    member TechnoMeter's Avatar
    Join Date
    Apr 2013
    Posts
    1,636
    Blog Entries
    421

    Forex Strategy: USD/JPY Dojis Denote Deliberation Amongst Bulls

    Talking Points

    • USD/JPY Technical Strategy: Longs preferred on breakout
    • Dojis on both the daily and four hourly charts suggest indecision
    • Clearance of resistance at 102.70 may open advance to 103.50


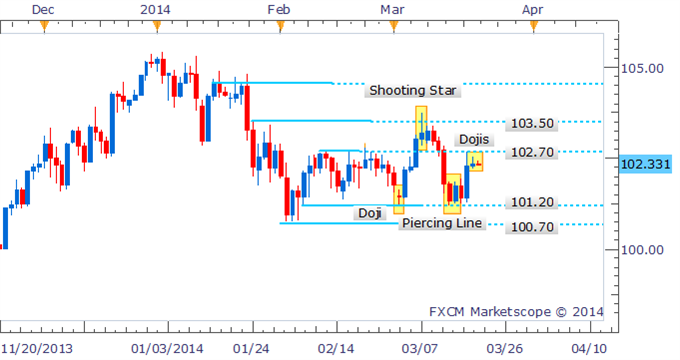
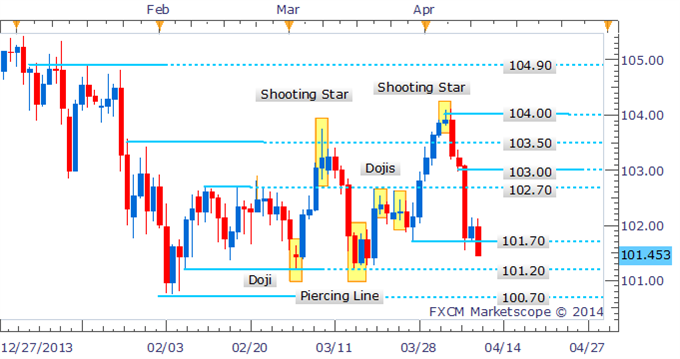
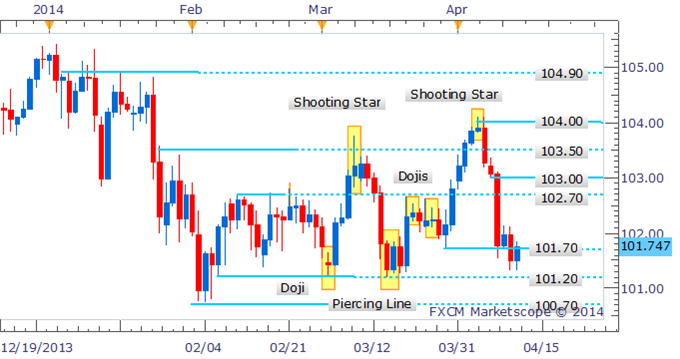
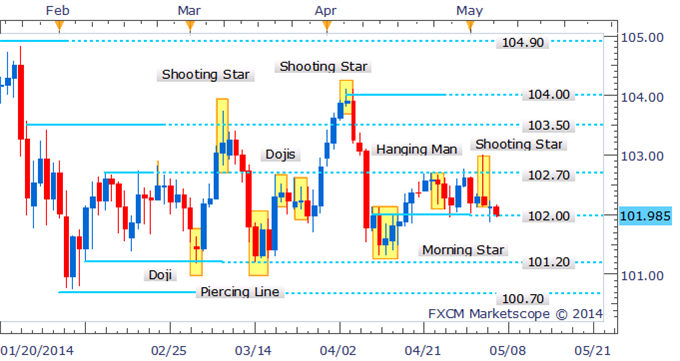
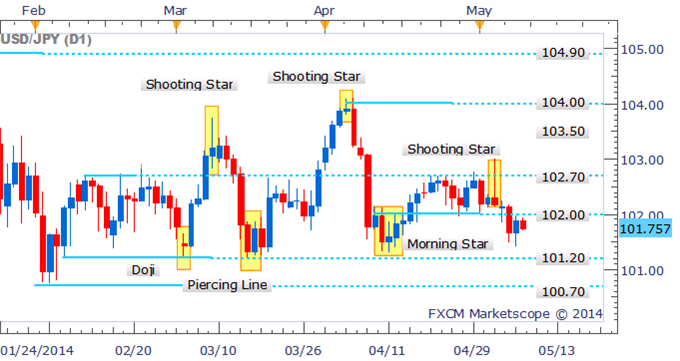
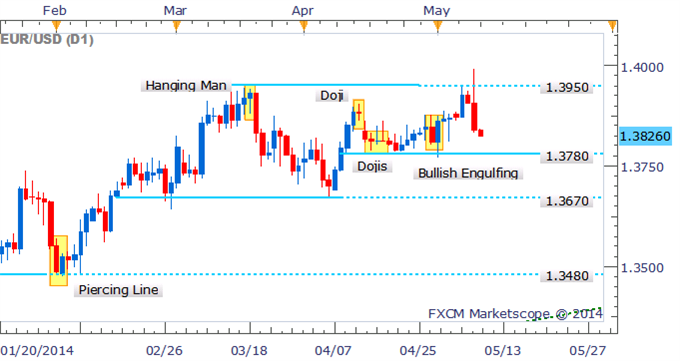
    USD/JPYhas jumped towards the 102.70 level of resistance following the formation of a Piercing Line formation on the daily (see below). However, a pair of Doji candles denotes some deliberation amongst the bulls and suggests new longs are better served on a clearance of 102.70 which would likely open up the 103.50 mark.

    USD/JPY: Dojis Denote Deliberation


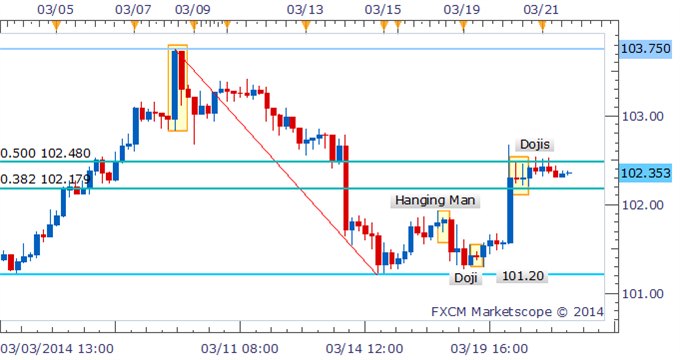
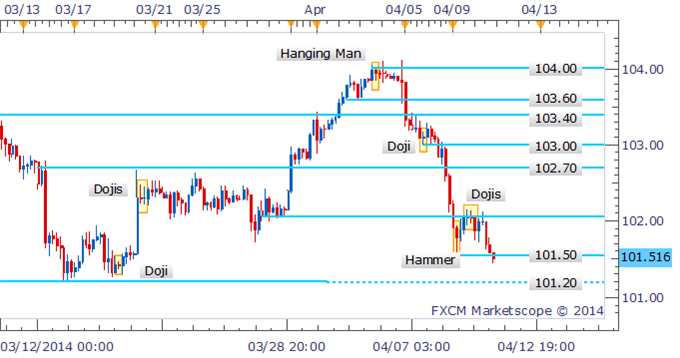
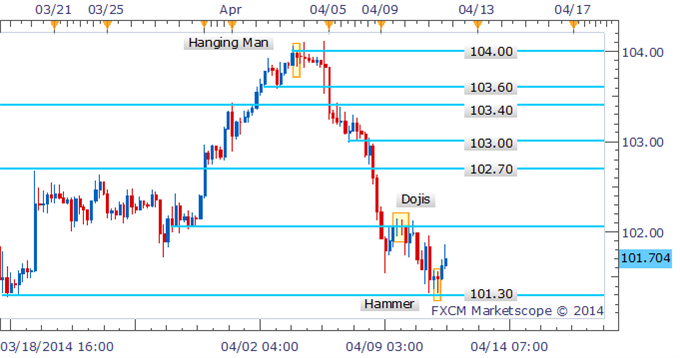
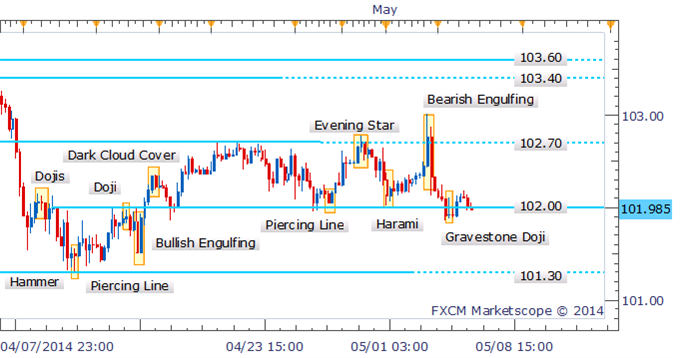
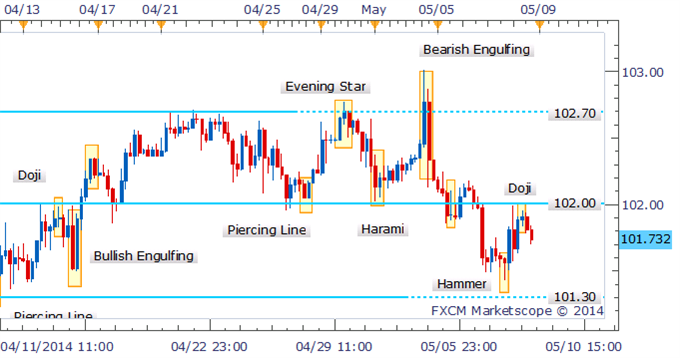
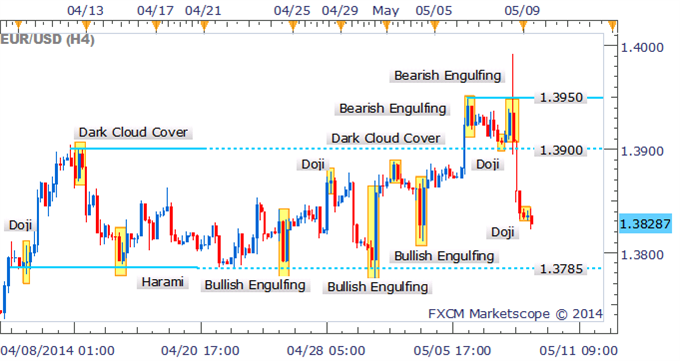
    Drilling down to the four hour chart; there is evidence of a drawn-out struggle between the bulls and bears around the critical 102.50 intraday resistance level. While the Doji candlesticks signal indecision, a bearish reversal pattern would be required to support a bearish technical bias for USD/JPY.

    USD/JPY: Intraday Resistance Holds At 102.40


    By David de Ferranti, Market Analyst, FXCM

    More...

  2. #12
    member TechnoMeter's Avatar
    Join Date
    Apr 2013
    Posts
    1,636
    Blog Entries
    421

    Forex: EUR/USD Technical Analysis

    • EUR/USD Technical Strategy: Pending Short
    • Support: 1.3779-81 (38.2% Fib ret., channel floor), 1.3721 (50% Fib ret.)
    • Resistance: 1.3850 (23.6% Fib ret.), 1.3876 (trend line)


    An actionable short Euro trade setupin line with our long-term fundamental outlook remains elusive after an expected move lower the US Dollar. The spotlight is on support in the 1.3779-1.38 area, marked by the 38.2% Fibonacci retracement and a rising channel bottom set from late January. We will look for a daily close below this boundary to confirm reversal and position for selling opportunities. The break lower would initially expose the 50% level at 1.3721. Alternatively, a breach above the 23.6% Fib at 1.3850 would target recently broken rising trend line support-turned-resistance at 1.3876.


    USDJPY and EURUSD Technical Analysis-eurusd-d1-metaquotes-software-corp-temp-file-screenshot-56433.png


    --- Written by Ilya Spivak, Currency Strategist for DailyFX.com


    More...

  3. #13
    member TechnoMeter's Avatar
    Join Date
    Apr 2013
    Posts
    1,636
    Blog Entries
    421

    Forex: USD/JPY Technical Analysis

    Talking Points:

    • USD/JPY Technical Strategy: Long at 102.82
    • Support:103.43 (23.6% Fib exp.)
    • Resistance: 104.11 (00.0% Fib exp.)


    The US Dollar advanced for a fifth consecutive day against the Japanese Yen having launched higher as expected after carving out a Triangle chart pattern. Prices are now testing resistance at 104.11, the 00.0% Fibonacci expansion.


    USDJPY and EURUSD Technical Analysis-usdjpy-d1-metaquotes-software-corp-temp-file-screenshot-63442.png


    USDJPY and EURUSD Technical Analysis-usdjpy-d1-metaquotes-software-corp-temp-file-screenshot-35887.png

  4. #14
    member TechnoMeter's Avatar
    Join Date
    Apr 2013
    Posts
    1,636
    Blog Entries
    421

    USD/JPY Bears Retreat As Hammer Points To A Potential Recovery

    Talking Points

    • USD/JPY Technical Strategy: Sidelines Preferred
    • Shooting Star pattern near 104.00 offered ominous warning
    • Hammer formation in intraday trade suggests a potential bounce


    After staging an impressive decline the USD/JPY bears appear to be retreating following a failed attempt to push through support at 101.70. Traders will be on the lookout for a bullish reversal signal on the daily, with the four hour chart already hinting at a recovery for the pair.

    USD/JPY: Shooting Star Offered Ominous Warning


    Drilling down to examine intraday price action; the four hour chart reveals the presence of a Hammer formation which is signaling a potential bounce for USD/JPY. This puts the resistance level at 102.70 back in focus in the session ahead.

    USD/JPY: Eyeing 102.70 As Next Resistance


    By David de Ferranti, Market Analyst, FXCM

    More...

  5. #15
    member TechnoMeter's Avatar
    Join Date
    Apr 2013
    Posts
    1,636
    Blog Entries
    421

    USD/JPY Resumes Declines After Recovery Stalls Alongside Doji Formations

    Talking Points

    • USD/JPY Technical Strategy: Sidelines Preferred
    • Shooting Star pattern near 104.00 offered ominous warning
    • Dojis highlighted hesitation by the bulls following test of 102.00


    USD/JPY has resumed its descent as the bears once again take charge of price action. The absence of a bullish reversal signal on both the daily and four hour chart casts doubt over the potential for a recovery.

    USD/JPY: Shooting Star Offered Ominous Warning


    Drilling down to examine intraday price action; the four hour chart reveals several Doji formations near the critical 102.00 handle, which signaled the potential for the USD/JPY recovery to stall. In the session ahead, buyer s may look to step in at prior support near 101.20.

    USD/JPY: Intraday Recovery Stalled Near 102.00


    By David de Ferranti, Market Analyst, FXCM

    More...

  6. #16
    member TechnoMeter's Avatar
    Join Date
    Apr 2013
    Posts
    1,636
    Blog Entries
    421

    USD/JPY Recovers Ground As Hammer Hints At Intraday Bounce

    Talking Points

    • USD/JPY Technical Strategy: Sidelines Preferred
    • Shooting Star pattern near 104.00 offered ominous warning
    • Hammer on four hour chart hints at intraday bounce


    USD/JPY has recovered some ground in recent trading, although sellers appear to be capping gains for the pair near the 101.70 mark. The daily chart may be set to post an Inside Day pattern, which could hint at more significant bounce. However, the current candle has yet to close and receive confirmation.

    USD/JPY: Shooting Star Offered Ominous Warning


    Drilling down to examine intraday price action; the four hour chart reveals a Hammer formation that has received confirmation. Further gains in intraday trade are likely to once again be met by selling pressure at 102.00.

    USD/JPY: Sellers Likely To Emerge At 102.00


    By David de Ferranti, Market Analyst, FXCM

    More...

  7. #17
    member TechnoMeter's Avatar
    Join Date
    Apr 2013
    Posts
    1,636
    Blog Entries
    421

    USD/JPY Teases Traders Near 102.00 Following Bearish Candlestick Pattern

    Talking Points
    • USD/JPY Technical Strategy: Pending short
    • Prices breaking below recent range-bottom
    • Bearish Engulfing pattern suggests sellers in control


    USD/JPY may be set tor break its narrow range between 102.00 and 102.70. The emergence of a Shooting Star formation suggests the bears are looking to firm their grip on prices. A daily close below 102.00 would be seen as an opportunity to enter short with a target offered by the next level of support at 101.20.

    USD/JPY: Threatens Break of Recent Range Following Shooting Star


    Examining the four hour chart, the Bearish Engulfing pattern near 102.70 has resulted in extended declines for USD/JPY. However a Gravestone Doji suggests some hesitation from sellers near 102.00. This reinforces the need to wait for a daily close to demonstrate strong conviction from the bears.

    USD/JPY: Bearish Engulfing Pattern Near Key Resistance Delivers Declines


    By David de Ferranti, Market Analyst, DailyFX

    More...

  8. #18
    member TechnoMeter's Avatar
    Join Date
    Apr 2013
    Posts
    1,636
    Blog Entries
    421

    USD/JPY Bears In Control Sub 102.00 With Reversal Signal Lacking

    Talking Points

    • USD/JPY Technical Strategy: Shorts Preferred
    • Prices break below 102.00 following Shooting Star pattern
    • Doji suggests some hesitation from the bears in intraday trade


    USD/JPY remains below the psychologically-significant 102.00 handle with the absence of a bullish reversal signal making a bounce look unlikely at this stage. Further declines may be met by buying support at the 101.20 mark.

    USD/JPY: Open To Further Declines With Bullish Candlestick Missing


    Examining the four hour chart; the Doji near 102.00 signaled a lack of conviction amongst the bulls near the key resistance level. With a bullish reversal pattern also absent in intraday trade, the potential for a bounce may be limited.

    USD/JPY: Bulls Lose Steam On Retest Of 102.00


    By David de Ferranti, Market Analyst, DailyFX

    More...

  9. #19
    member TechnoMeter's Avatar
    Join Date
    Apr 2013
    Posts
    1,636
    Blog Entries
    421

    EUR/USD Eyes 1.3780 As Candlesticks Suggest Bears In Control

    Talking Points

    • EUR/USD Technical Strategy: Shorts Preferred
    • Long upper wick on daily candle highlights significant selling pressure
    • Bearish Engulfing pattern on four hour chart foreshadowed intraday dip


    EUR/USDhas plunged after failing to claim the psychologically-significant 1.4000 handle in recent trading. The intraday volatility has failed to yield a classic candlestick reversal pattern. However, the length of the upper wick and body of the daily candle suggests the bears are in control of prices. This opens up further declines towards the next noteworthy level of support at 1.3780.

    EUR/USD: Eyeing 1.3780 As Bears Take Control


    A Bearish Engulfing pattern near 1.3950 offered an intraday signal that declines were on the way for the Euro. While the Asian session has yielded a couple of Doji formations which hints at some hesitation from the bears, they are not enough to suggest a bounce at this stage.

    EUR/USD: Bearish Engulfing Pattern Sparks Intraday Dip


    By David de Ferranti, Market Analyst, DailyFX

    More...

  10. #20
    member TechnoMeter's Avatar
    Join Date
    Apr 2013
    Posts
    1,636
    Blog Entries
    421

    USD/JPY Clears 102.00 As Harami Suggests Further Gains

    Talking Points

    • USD/JPY Technical Strategy: Longs Preferred
    • Push back above 120.00 opens 102.70
    • Harami pattern supports further gains


    USD/JPY’s push past 102.00 following the Harami formation on the daily puts the next noteworthy resistance level at 102.70 on the cards. The absence of a bearish signal on the daily and four hour charts gives little indication of a potential intraday reversal.

    USD/JPY: Prices Push Past 102.00 Following Harami Pattern


    An examination of intraday price action on the chart below highlights the hesitation from the bulls near 102.00. However following a push past the psychologically-significant level of resistance USD/JPY is eying the 102.70 mark.

    USD/JPY: Hammer Foreshadowed Recovery


    By David de Ferranti, Market Analyst, DailyFX

    More...

Page 2 of 29 FirstFirst 1 2 3 4 12 ... LastLast

Tags for this Thread

Bookmarks

Posting Permissions

  • You may not post new threads
  • You may not post replies
  • You may not post attachments
  • You may not edit your posts
  •