
 1Likes
 LinkBack URL
 About LinkBacks


- GBPUSD key weekly reversal
- AUDUSD decision time
- USDJPY volume details serves as warning for bulls
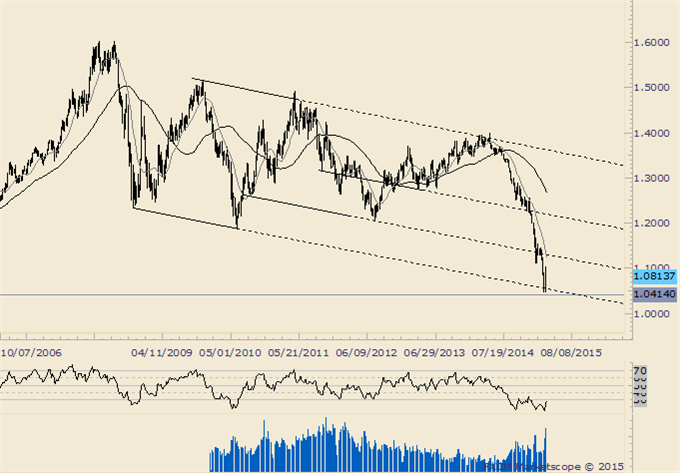
EUR/USD
Weekly
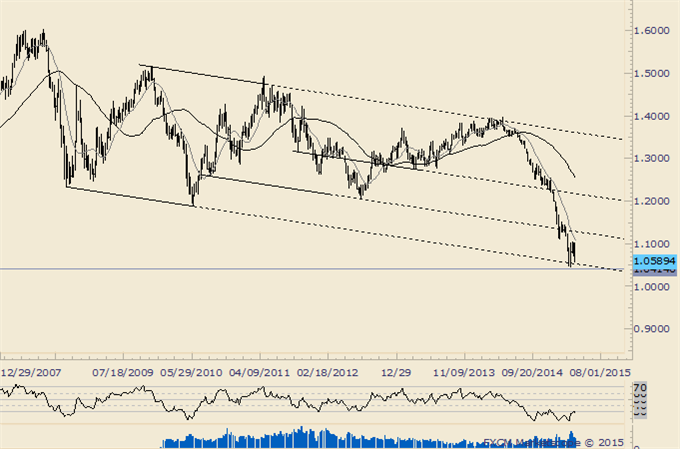
-“There is a long term level to be aware of. The line that extends off of the 2008 and 2010 lows is at about 1.0545 this week. The March 2003 low is at 1.0499. The next area of long term interest probable isn’t until about .96 (2001 high and Sep 2002 low). Above 1.08 would indicate a behavior change.” EURUSD finished the week above 1.08, indicating potential for a period of sideways trading in the coming months. The first important resistance stems from former slope support just below 1.13 over the next several weeks.
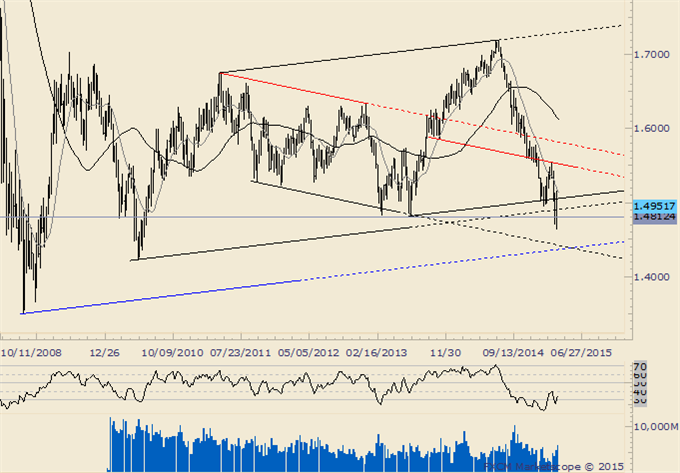
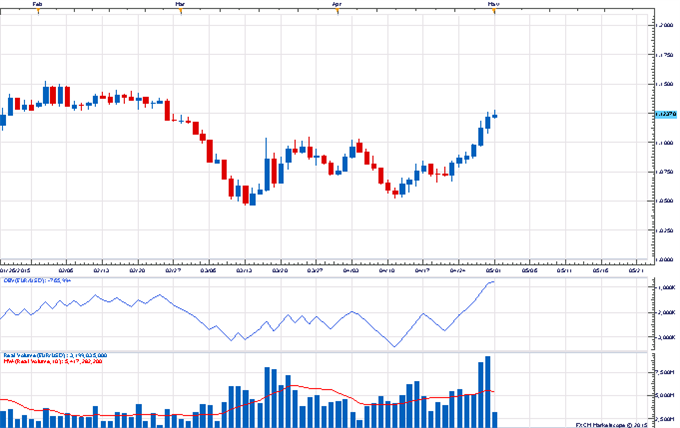
GBP/USD
Weekly
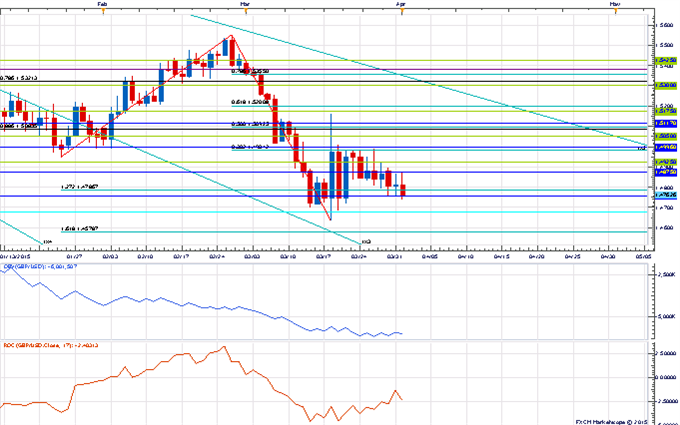
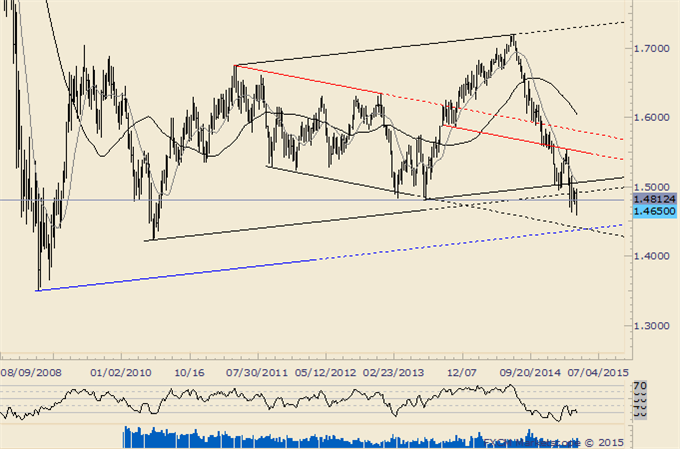
-“A breakout from a 1 month inverse head and shoulders pattern is valid above today’s low (breakout day) but GBPUSD does face channel resistance at this level. The reversal pattern’s objective is 1.5494, which is in line with the December low at 1.5485.”
-“GBPUSD met the target and traded into the mid-1.5500s this week. There is good resistance here from former lows and slopes on multiple time frames. A breakdown towards 1.4250-1.4350 may be underway.” The weekly reversal casts doubt on the call for 1.4350. Be aware of slope resistance that caught the February high near 1.55 over the next several weeks.
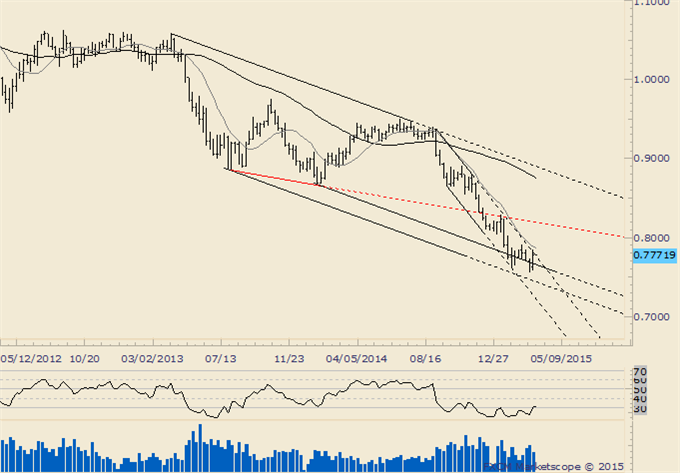
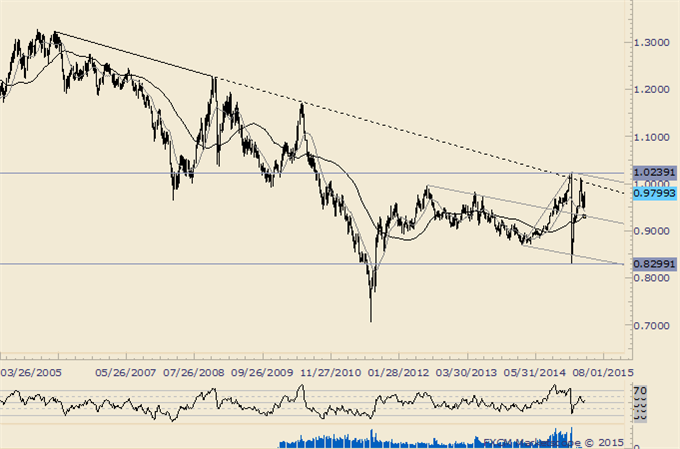
AUD/USD
Weekly
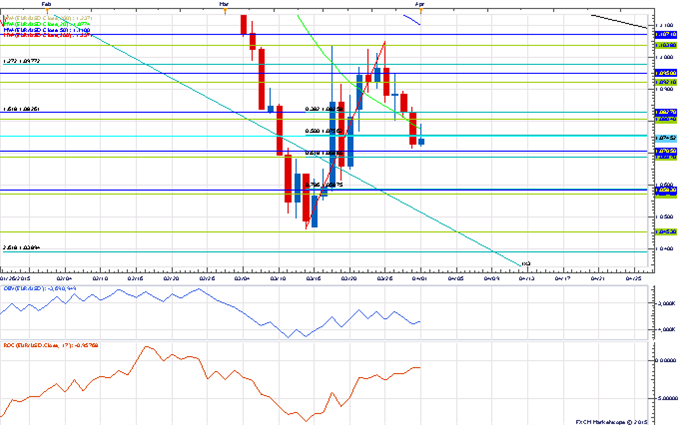
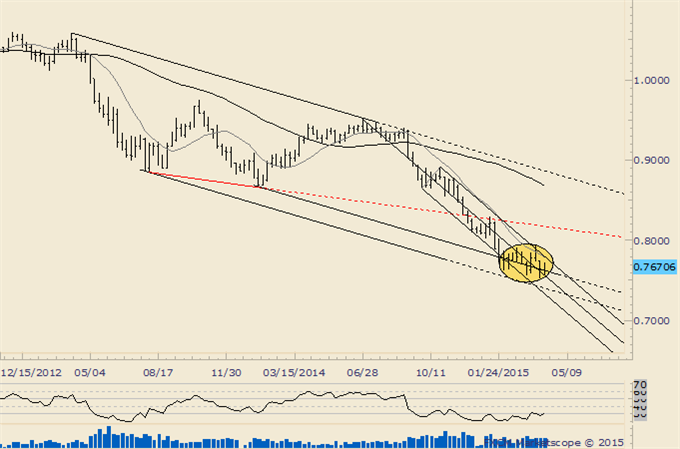
-“AUDUSD Focus remains on the lower end of the channel in the low .70s but channel resistance must hold. A push above would indicate an important behavior change.” It’s decision time for AUDUSD as the rate is pushing the limits of resistance that has contained the downtrend since September. A break higher opens up .8180 (former support line turned resistance in January).
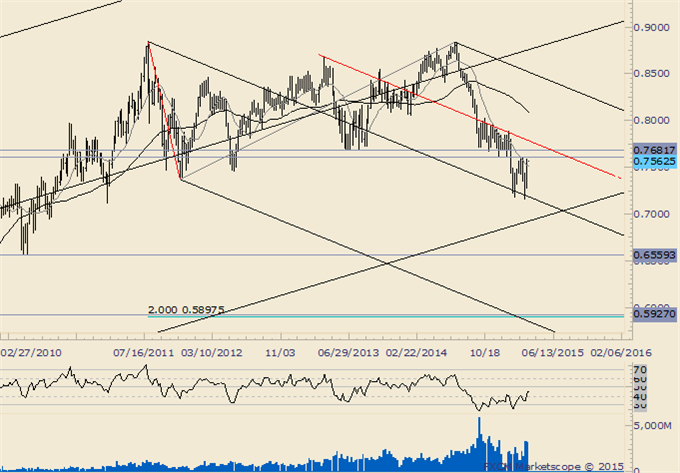
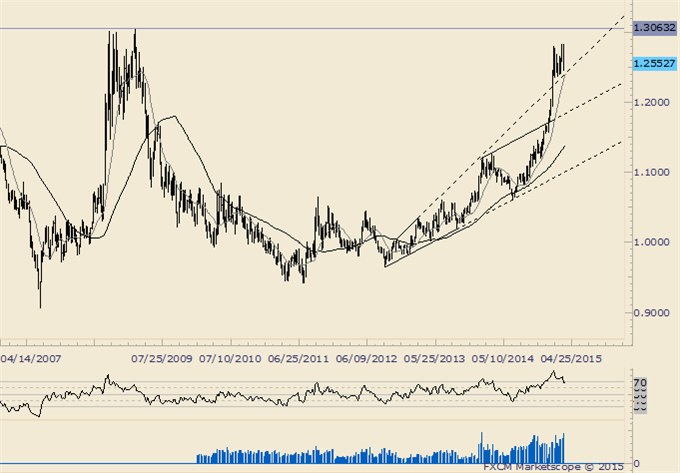
NZD/USD
Weekly
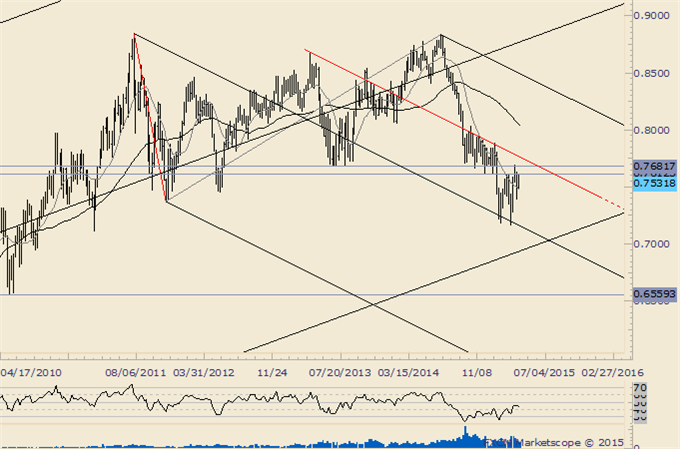
-“NZDUSD traded to the 61.8% retracement of its 3 year range today (.7929) and the next level of interest probably isn’t until the 2013 Labor Day gap at .7722. One can’t help but notice that an epic double top is possible with a target of .5898. That would trigger on a drop below .7370.”
-If the major double top is going to prove successful, then the February high needs to remain in place. Risk of a double bottom has emerged that would yield an objective of .8038 although Kiwi would probably face pressure from longer term slope resistance near .7780.
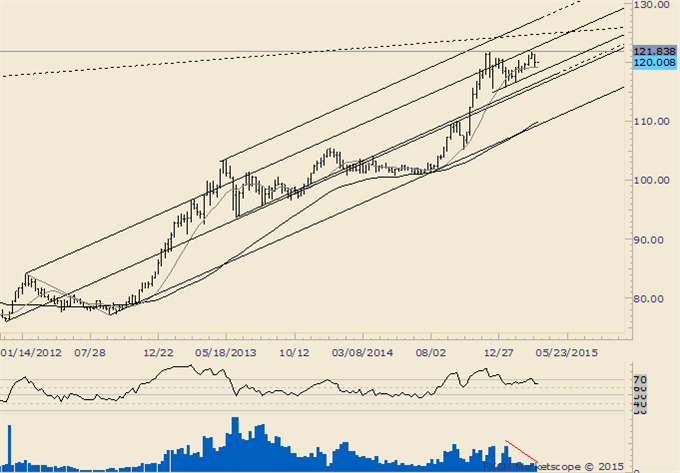
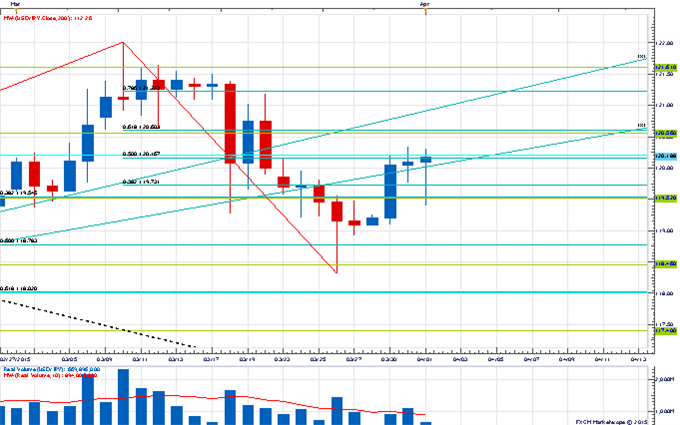
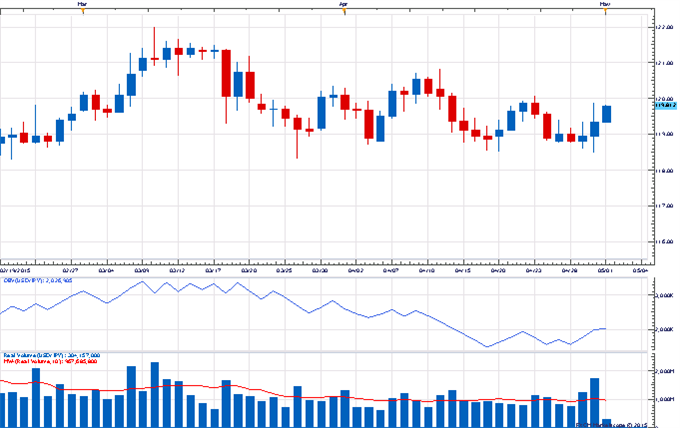
USD/JPY
Weekly
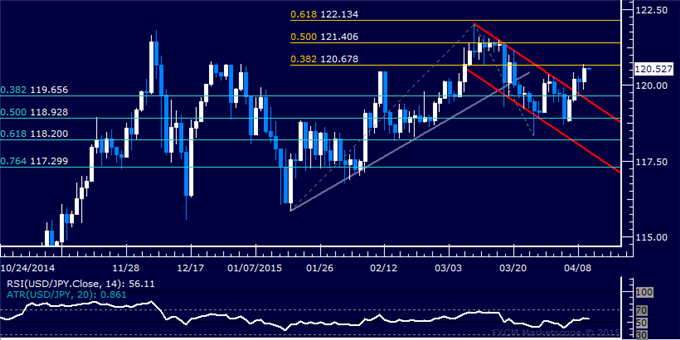
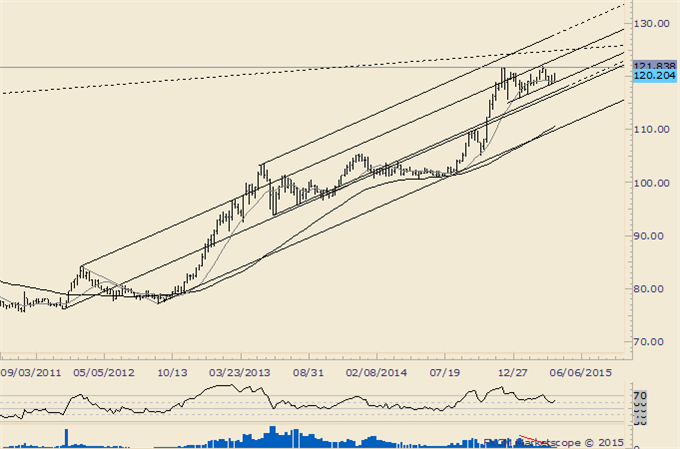
-“Continue to favor a broad range as 119.80-120.70 as resistance and 116.40-117.10 as support. A move through either one of these zones would define target zones of 124-128 and 110-114.”
-“USDJPY is flirting with a breakout from the cited resistance zone (120.70). The next area of interest on the upside would be 123.16-124.13. A daily close below 119.50 would indicate a reversal.” The lack of volume on strength since January warns that all is not well with the USDJPY uptrend. A daily close below 119.50 would probably usher in 116.50 quickly.
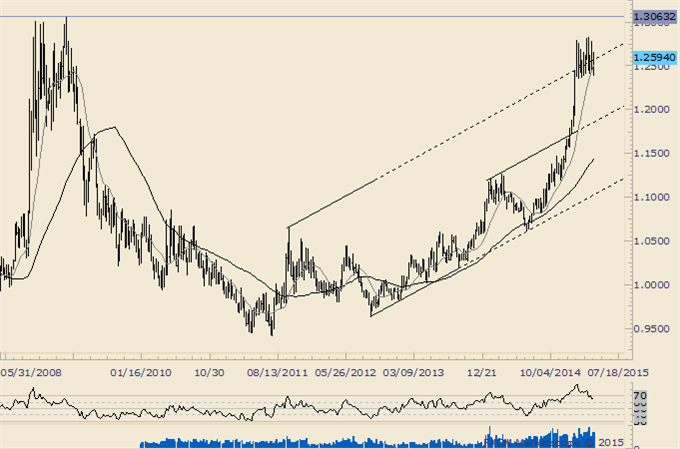
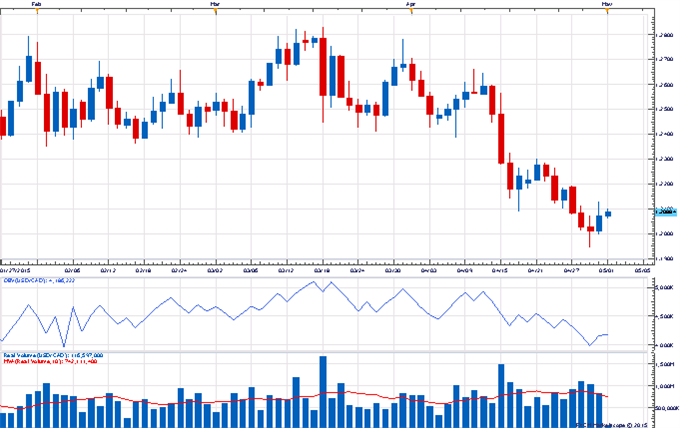
USD/CAD
Weekly
-“The contracting range indicates potential for a triangle from the high. Typically, a triangle will lead to a thrust in the direction of the preceding trend.” Triangle targets are 1.3074 and 1.3245. If the path is still higher, then former triangle resistance should provide support if reached (about 1.2550).” The slight new high satisfies minimum requirements for a triangle thrust. USDCAD risks a return to 1.19 (old resistance line).
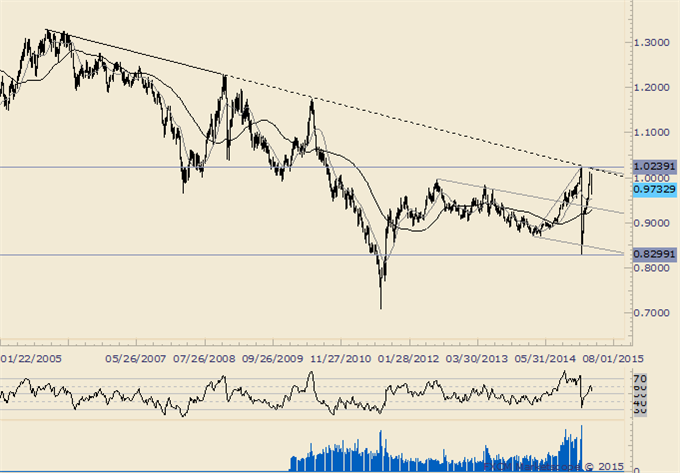
USD/CHF
Weekly
-“An upper parallel and long term trendline are possible resistance near 1.0180 before the January high.” 1.0180 is still a level to know for resistance but also be aware of 1.0021 as a level that could influence as resistance now. Support is estimated at .9288.
More...


 Reply With Quote


Bookmarks