
 1Likes
 LinkBack URL
 About LinkBacks


- EURUSD and AUDUSD at critical near term levels
- USDJPY breakout attempt from 6 month coil
- USDCAD former floor of interest near 1.2400
EUR/USD
Weekly
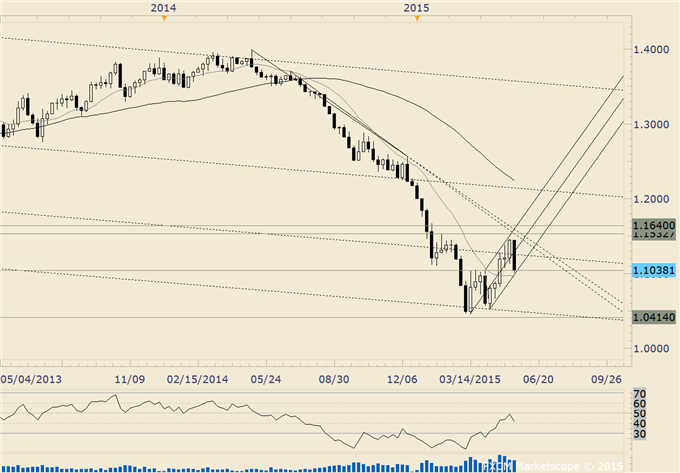
-“Several longer term technical observations are worthy of note; the rate found low at an important long term level. The speculative crowd has never been more bearish…ever. Such conditions typically precede important reversals…although not necessarily right away. A break above the resistance lines (old support) would indicate that behavior has significantly changed and open up a run on 1.13.”
-EURUSD has plummeted since last Friday but is now trading around support from a lower parallel near 1.10. The rate has to hold here in order to maintain a near term constructive outlook. Failure to turn up now opens up 1.0845 (61.8% and 4/17 high) and quite possibly resumption of the broader downtrend.
GBP/USD
Weekly
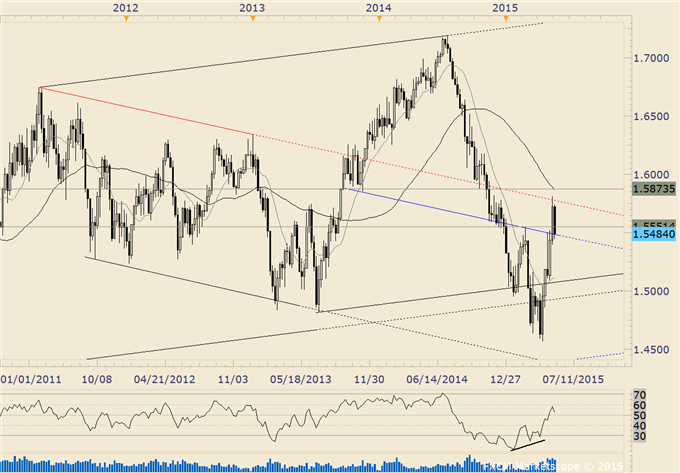
-“The sharp turn higher (and pending weekly reversal) is promising for longer term bottoming prospects, especially in light of the mentioned divergence and 2 large range weekly reversals in the last 5 weeks. Focus is now on the sliding parallel (lower red line) just shy of 1.55 over the next several weeks.”
-“GBPUSD has met and slightly exceeded 1.55. This is resistance so the next near term move could go a long way in determining the next larger move. A break higher would open up the Dec high (near the next slope level) at 1.5785.”
-Keep the 50% decline from the 2014 high / Oct low at 1.5874/78 in mind for a top if reached. Weakness below 1.5390 would open up 1.5190 and 1.5090.
AUD/USD
Weekly
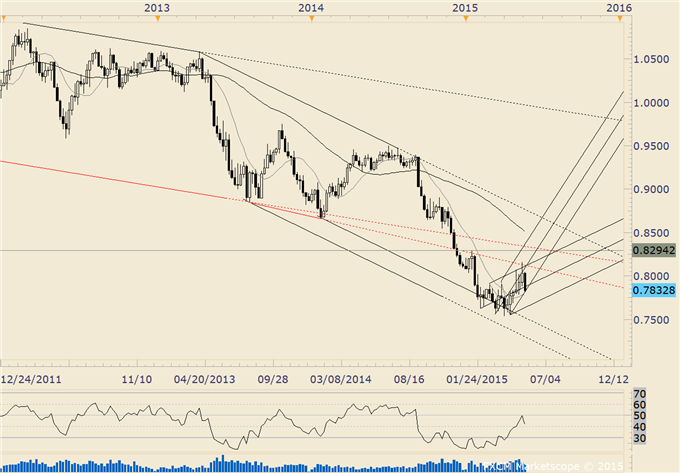
-“Trade outside of the bearish upper parallel that has contained strength since late October would shift focus to a former support line (turned resistance in January) near .8180.”
-“A broadening bottom pattern yields an objective of .8342 (just above the Jan high at .8294) but AUDUSD has met the line that extends off of the Aug 2013 and Jan 2014 lows (former support).”
-AUDUSD is at critical support and a break risks formation of a broader range.
NZD/USD
Weekly
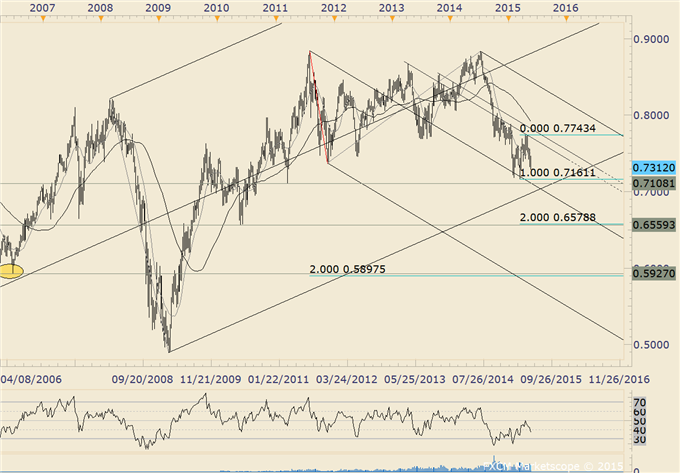
-“One can’t help but notice that an epic double top is possible with a target of .5898. That would trigger on a drop below .7370.”
-“The big NZDUSD double top has failed so far but slope resistance comes into play more or less at the current level and near .7800.”
-A bearish wedge pattern has formed and yields an objective of .6607.
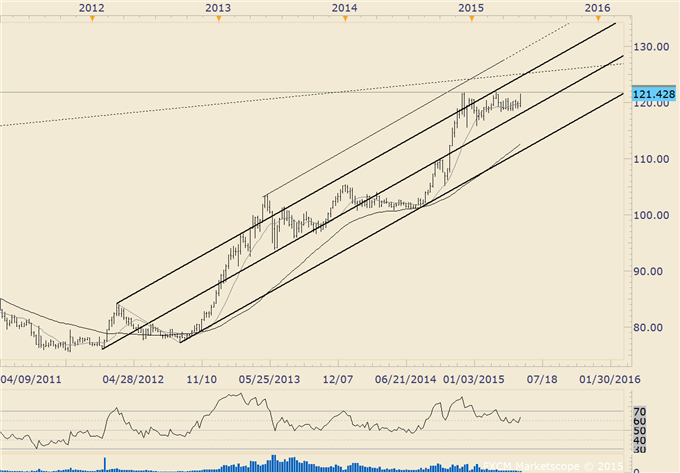
USD/JPY
Weekly
-A USDJPY breakout from the 6 month coil would open up 123.16-124.13 (high close from June 2007 and 2007 high). A measured objective from the pattern yields 128.12.
-Failure to maintain 119.60 would negate bullish considerations.
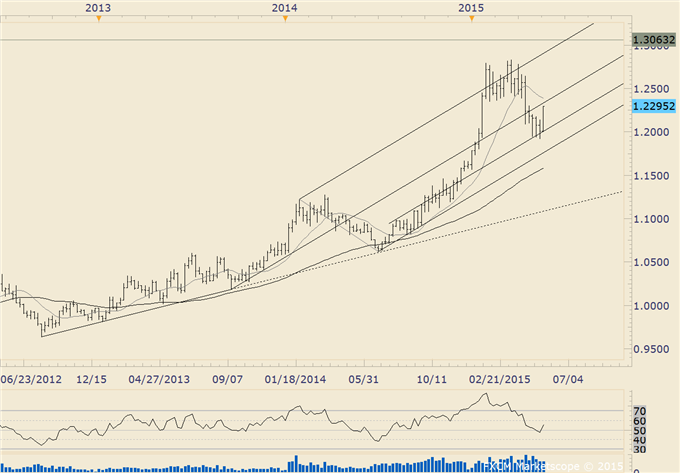
USD/CAD
Weekly
-“The breakdown from a 2 and a half month topping pattern could ‘kick-off’ a much larger decline but near term focus is on early congestion from 1.1931 to 1.2046.”
-USDCAD has turned up from just below 1.1931 (low was 1.1919). The break above the median line opens up a run on former support from 1.2350 to 1.2447.
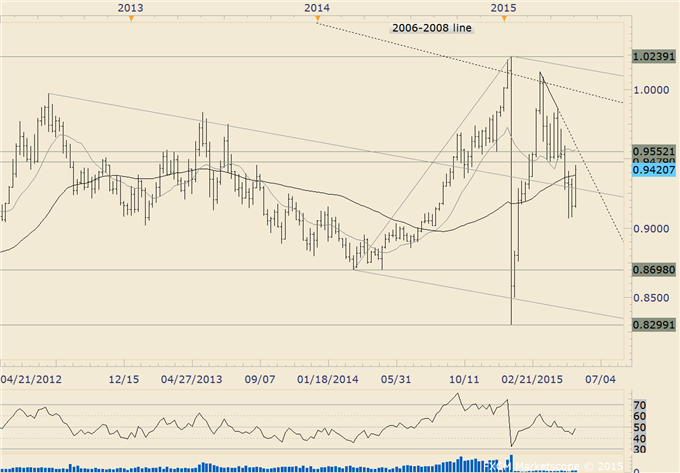
USD/CHF
Weekly
-“USDCHF has reversed from 9 year trendline resistance. Focus is on the median line (about .9300) that extends off of the 2012 high. This line crosses through highs in 2013 and the October 2014 low. The 52 week MA is near this line as well.”
-USDCHF is trading ‘around’ the long watched median line. A short term double bottom has completed and yields a target of .9637 but beware of resistance from the combination of trendlines and former lows near .9550 next week.
More...


 Reply With Quote


Bookmarks