
 1Likes
 LinkBack URL
 About LinkBacks


Talking Points:
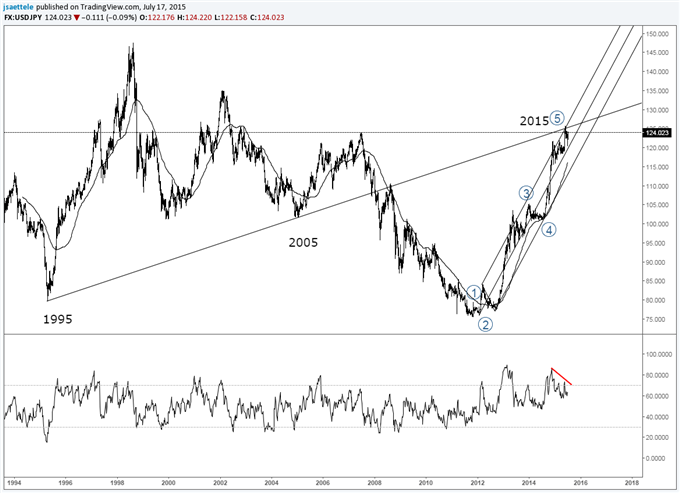
- USD/JPY Technical Strategy: Flat
- Support: 123.18, 122.36, 121.54
- Resistance: 124.09, 125.11, 125.93
The US Dollar stalled below the 124.00 figure after attempting to mount a recovery against the Japanese Yen. Near-term resistance is at 124.09, the 23.6% Fibonacci expansion, with a break above that on a daily closing basis exposing the 38.2% level at 125.11. Alternatively, a reversal below the 38.2% Fibretracement at 123.18 clears the way for a challenge of the 50% threshold at 122.36.
Risk/reward considerations argue against entering long with prices in close proximity to resistance. On the other hand, the absence of a defined bearish reversal signal suggests taking up the short side is premature. We will remain flat for now, waiting for an actionable opportunity to present itself.
--- Written by Ilya Spivak, Currency Strategist for DailyFX.com
More...


 Reply With Quote


 It was compared with last year or with 5 minute price? Which price was used? daily? weekly? H4? ...


Bookmarks