
 3Likes
 LinkBack URL
 About LinkBacks


XAG/USD: silver returns to global growth
Current trend
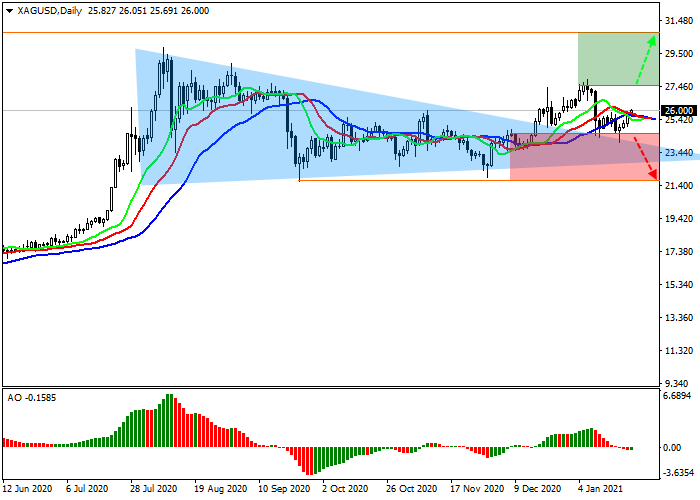
Silver contracts are correcting upwards, trading at $26 an ounce.
Of all the assets of the metal group, silver has the highest chances of further growth. The asset is not as dependent on fluctuations in global capital as gold, and due to its much smaller money capacity, responds more quickly to fluctuations in the US dollar. The recent decline in the USD has led to the current strengthening of silver.
In the future, the instrument can be supported by stability in the Chinese economy, the main importer of the metal. Yesterday, several key data were published, such as the rate of the People's Bank of China, which remained at 3.85%, and the volume of industrial production which increased by 7.3%. Thus, despite a new outbreak of coronavirus in some provinces, economic activity and demand in the PRC are strengthening, supporting silver.
Support and resistance
On the global chart of the asset, the price, after a rather significant downward impulse, is correcting upwards again, reversed from the resistance line of the global triangle pattern. Technical indicators are uncertain. The fluctuation range of the EMA on the Alligator indicator is narrowed, and the histogram of the AO oscillator is in the sell zone.
Resistance levels: 27.54, 30.00.
Support levels: 24.60, 21.76.


 Reply With Quote


Bookmarks