Page 58 of 164 FirstFirst ... 8 48 56 57 58 59 60 68 108 158 ... LastLast
Results 571 to 580 of 1635

Wave Analysis by InstaForex

This is a discussion on Wave Analysis by InstaForex within the Analytics and News forums, part of the Trading Forum category; GBP / USD. December 18th. The results of the day. Boris Johnson is ready to return to the "tough" Brexit ...


  1. #571
    Senior Member InstaForex Gertrude's Avatar
    Join Date
    Sep 2015
    Posts
    1,885
    GBP / USD. December 18th. The results of the day. Boris Johnson is ready to return to the "tough" Brexit and takes a tough stance in future negotiations with the EU


    4 hour time-frame
    Amplitude of the last 5 days (high-low): 108p - 179p - 354p - 101p - 234p.
    Average volatility over the past 5 days: 196p (high).

    The GBP / USD currency pair on Wednesday trades continued a steady downward movement, which, from our point of view, is justified by only one factor. This factor is elections to the Parliament of Great Britain. They were left behind and deprived market participants of the foundation and the reason that allowed them to buy the pound in the last two months. Now that it is clear that the entire power in the country is concentrated in the hands of the Conservative Party, that neither Labor, nor Scottish nationalists, nor, moreover, other political forces, and even all of them combined, can prevent Boris Johnson from doing so, gives an opportunity with high accuracy to predict what will happen in the state in the near future. December 20 will be a vote on a bill of agreement between Britain and the European Union. Certainly it will be adopted by a majority vote and on January 31, 2020 (or even earlier), the so-called "transition period" will begin, during which the Boris Johnson government will need to agree with Brussels on all aspects of the further coexistence of the Alliance and the Kingdom, which has left the jurisdiction of Brussels. However, if earlier Boris Johnson and his cabinet had to agree, because Parliament required it, now he absolutely does not have to do it. Recall that initially Johnson was ready to implement the "hard" Brexit without any agreements with the European Union. Now that there are already agreements, it is possible to continue the dialogue with Michel Barnier and the company, but the British Prime Minister has already made it clear that he will not make any concessions, prolongation of the "transitional period" categorically rejects (now in the UK there is a law that allows extending the "transitional period" once for a period of 2 years, if the parties fail to manage to reach an agreement before the expiration of the initial period). According to Johnson, any negotiations with the EU should be completed by December 31, 2020, and if London and Brussels fail to meet this deadline, then the gap will occur without an agreement at all. That is, in fact, the government of Boris Johnson, having received full power in the country, is absolutely not opposed to returning to the original version with the "hard" Brexit. Or is this a new plan by Boris Johnson aimed at political blackmail of the leaders of the European Union. Approximately Johnson's strategy may be as follows. The Prime Minister threatens a "tough" divorce and requires speedy negotiations and the speedy conclusion of a trade agreement. If the EU drags out the time during which Britain continues to pay contributions to the European treasury, to remain under all EU financial standards, then Johnson is ready to withdraw without a "deal". Since the "tough" Brexit is not beneficial for the EU itself, then, according to the Prime Minister, the Europeans will be much more accommodating. In any case, negotiations will continue for at least the next year, which, according to the vast majority of experts, will be difficult. And at best, a trade agreement will be concluded at the end of the year that will mitigate the negative effect of breaking all ties between London and Brussels. In the worst case, there will be no agreement,

    Macroeconomic statistics from the UK continues to leave much to be desired, however, today, when the pound continued to calmly drop in price, the only British report of the day - the consumer price index for November - did not disappoint market participants. According to experts, inflation in the Foggy Albion should have been reduced to 1.4% y / y, but this did not happen and the index remained at the level of the previous month - 1.5% y / y. This is not to say that this is great and now the British economy will begin to recover. This is just the absence of deterioration in one month. If we recall the rest of the macroeconomic statistics, it becomes clear that there are no reasons for joy and the British pound is likely to continue to fall against the US currency. Moreover, the most important topics for the US dollar (the impeachment of Donald Trump, trade wars and negotiations with China) have no effect on the movement of the GBP / USD pair. And macroeconomic statistics from across the ocean, if it does not please traders in 100% of cases, in most cases it turns out to be quite strong and does not disappoint. So it turns out that the prospects for the British currency are now approximately the same as those of the European currency - absolutely negative. We can still hypothetically hardly imagine what should happen in the States or the European Union, so that the balance of power between their economies is reversed. then the majority comes out strong enough and does not disappoint. So it turns out that the prospects for the British currency are now approximately the same as those of the European currency - absolutely negative. We can still hypothetically hardly imagine what should happen in the States or the European Union, so that the balance of power between their economies is reversed. then the majority comes out strong enough and does not disappoint. So it turns out that the prospects for the British currency are now approximately the same as those of the European currency - absolutely negative. We can still hypothetically hardly imagine what should happen in the States or the European Union, so that the balance of power between their economies is reversed. so that the balance of power between their economies is reversed. then the majority comes out strong enough and does not disappoint. So it turns out that the prospects for the British currency are now approximately the same as those of the European currency - absolutely negative. We can still hypothetically hardly imagine what should happen in the States or the European Union, so that the balance of power between their economies is reversed. so that the balance of power between their economies is reversed. then the majority comes out strong enough and does not disappoint. So it turns out that the prospects for the British currency are now approximately the same as those of the European currency - absolutely negative. We can still hypothetically hardly imagine what should happen in the States or the European Union, so that the balance of power between their economies is reversed.

    Trading recommendations:

    GBP / USD continues to form a new downtrend. The price has worked out the bottom line of the Ichimoku cloud and the first support level of 1.3083. Thus, a rebound from these strong support levels may trigger a round of upward correction. However, without rebounding the price from the indicated supports or without turning up the MACD indicator, it is not recommended to reduce sell positions. The following targets for trading are lowering 1.2931 and 1.2833. It is recommended that purchases of the British pound be returned no earlier than the price fixing above the Kijun-sen line, which is clearly not expected in the coming days.

    Explanation of the illustration:
    Ichimoku indicator:
    Tenkan-sen is the red line.
    Kijun-sen is the blue line.
    Senkou Span A - light brown dotted line.
    Senkou Span B - light purple dashed line.
    Chinkou Span - green line.
    Bollinger Bands Indicator: 3 yellow lines.
    MACD indicator:
    Red line and bar graph with white bars in the indicators window.
    Support / Resistance Classic Levels:
    Red and gray dotted lines with price symbols.
    Pivot Level:
    Yellow solid line.
    Volatility Support / Resistance Levels:
    Gray dotted lines without price designations.
    Possible price movement options:
    Red and green arrows.Translation

    Analysis are provided byInstaForex.
    Best regards, PR Manager
    Learn more about InstaForex Company at http://instaforex.com

  2. #572
    Senior Member InstaForex Gertrude's Avatar
    Join Date
    Sep 2015
    Posts
    1,885
    Forecast for AUD / USD on December 20, 2019

    AUD / USD
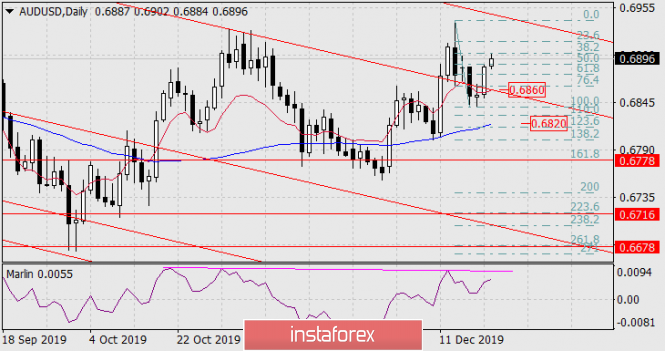
    Yesterday, the Australian dollar grew 32 points on good employment data which makes the unemployment rate fell from 5.3% to 5.2%. In general, the correctional growth from the fall of the "Aussie" from December 13 to 17 was 61.8% which is 38.2% on the chart. Due to this, the growth may stop since a double divergence has already been formed on the Marlin oscillator, and the probability of triple divergence is historically small. The first goal of the new wave of decline is the nested price channel line at 0.6860. Overcoming this level opens up prospects for a medium-term decrease in the Australian dollar which is at 0.6820 according to the MACD line near the Fibonacci level of 123.6%, and at 0.6778 which is the reaction level of 161.8%. This continues on to the underlying embedded price channel line which is at 0.6678.


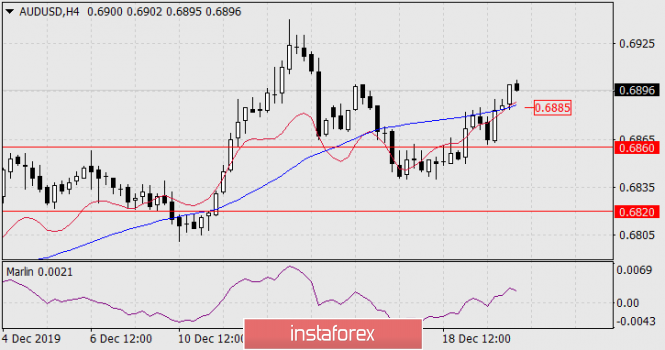
    On the four-hour chart, the price is currently above the balance lines (indicator red) and MACD, and the Marlin oscillator is also in the growth zone. The departure of the price for these lines, below 0.6885, will reveal the main lowering scenario. The observed price above the indicator lines will be interpreted as false.


    *The market analysis posted here is meant to increase your awareness, but not to give instructions to make a trade.

    Analysis are provided byInstaForex.
    Best regards, PR Manager
    Learn more about InstaForex Company at http://instaforex.com

  3. #573
    Member
    Join Date
    Sep 2015
    Posts
    94
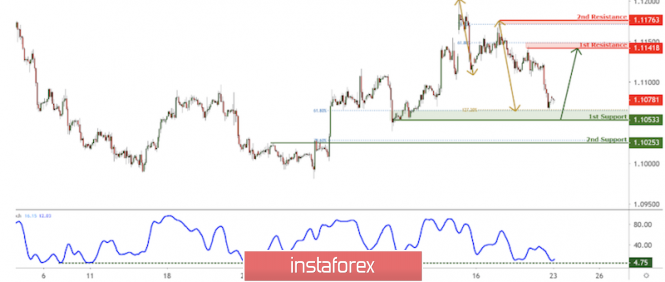
    EUR/USD approaching support, potential bounce!


    Trading Recommendation Entry: 1.10533

    Reason for Entry: 61.8% Fibonacci retracement, 127.2% fibonacci extension, horizontal swing low support

    Take Profit : 1.11418 Reason for Take Profit: horizontal swing high resistance, 61.8% fibonacci retracement

    Stop Loss: 1.10253 Reason for Stop loss:78.6% Fibonacci retracement, Horizontal pullback support


    *The market analysis posted here is meant to increase your awareness, but not to give instructions to make a trade.

  4. #574
    Member
    Join Date
    Sep 2015
    Posts
    94
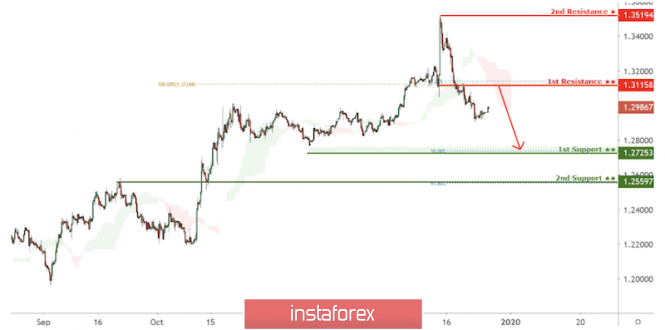
    GBP/USD approaching resistance, potential drop!


    Trading RecommendationEntry: 1.31158 Reason for Entry: 38.2% Fibonacci retracement, horizontal pullback resistance

    Take Profit : 1.27253 Reason for Take Profit:50% fibonacci retracementStop Loss: 1.35194 Reason for Stop loss:

    Horizontal swing high resistance


    *The market analysis posted here is meant to increase your awareness, but not to give instructions to make a trade.

  5. #575
    Member
    Join Date
    Sep 2015
    Posts
    94
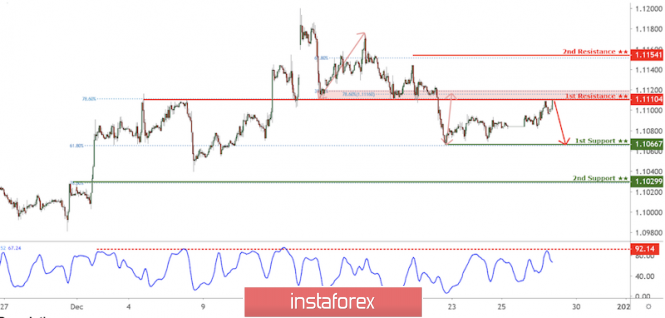
    EUR/USD approaching resistance, potential drop!


    Trading Recommendation Entry: 1.11104 Reason for Entry:

    Horizontal overlap resistance, 38.2% Fibonacci retracement, 78.6% Fibonacci extension Take Profit : 1.10667

    Reason for Take Profit: horizontal swing low support, 61.8% Fibonacci retracement Stop Loss: 1.11541

    Reason for Stop loss:Horizontal swing high resistance, 61.8% Fibonacci retracement


    *The market analysis posted here is meant to increase your awareness, but not to give instructions to make a trade.

  6. #576
    Senior Member InstaForex Gertrude's Avatar
    Join Date
    Sep 2015
    Posts
    1,885
    Forecast for EUR/USD on January 6, 2019

    EUR/USD

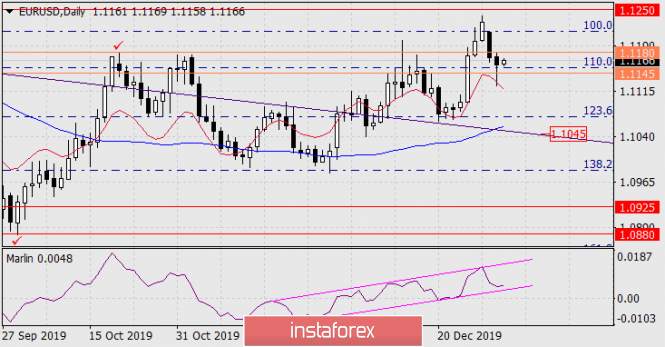
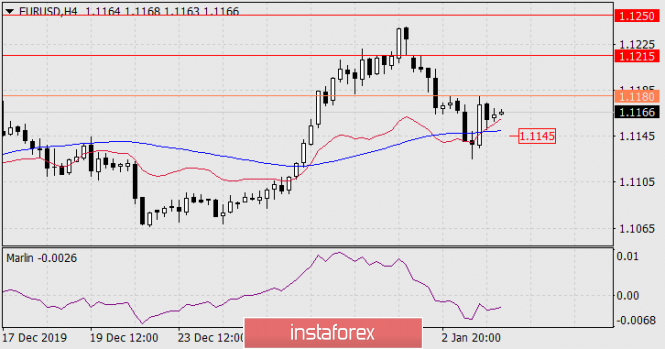
    Last Friday, the euro made an attempt to push the technical level of 110.0% Fibonacci on the daily chart, but it failed on its first attempt. On Saturday, US President Trump threatened to attack 52 Iran's targets in the event of Iran's military response to a US missile strike, leading to the assassination of General Soleimani. Trump was indirectly supported by Britain, Germany and France, once again urging Tehran to comply with the nuclear deal. We doubt the development of the conflict before the hot phase of the war with Iran, but the current situation can help the dollar in getting out of consolidation (of course, in the direction of strengthening), stretching from July last year.


    On the daily chart, the signal line of the Marlin oscillator approached the lower boundary of its own channel, the exit from which down will strengthen the fall of the euro. The purpose of the movement is the embedded line of the global downward price channel in the region of 1.1045.


    *The market analysis posted here is meant to increase your awareness, but not to give instructions to make a trade.

    Analysis are provided byInstaForex.
    Best regards, PR Manager
    Learn more about InstaForex Company at http://instaforex.com

  7. #577
    Senior Member InstaForex Gertrude's Avatar
    Join Date
    Sep 2015
    Posts
    1,885
    Ichimoku cloud indicator Daily analysis of EURUSD for January 7, 2020

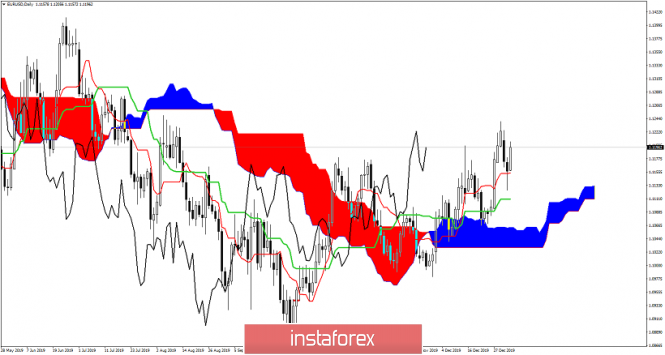
    EURUSD remains in a bullish trend continuing to make higher highs and higher lows. Price so far has respected the key Cloud support area of 1.1040-1.1050. Thus we continue to see more upside potential over the coming days.


    Price has broken above the Kumo (cloud) and has so far successfully back tested support. Price bounced off the Cloud and this was another bullish signal. EURUSD is now trading above the tenkan-sen (red line indicator) while the kijun-sen is trending below tenkan-sen with a positive slope. With the tenkan-sen above the kijun-sen we have supporting evidence of a bullish trend. We continue to expect this next leg higher to move closer to 1.1280.

    *The market analysis posted here is meant to increase your awareness, but not to give instructions to make a trade.

    Analysis are provided byInstaForex.
    Best regards, PR Manager
    Learn more about InstaForex Company at http://instaforex.com

  8. #578
    Senior Member InstaForex Gertrude's Avatar
    Join Date
    Sep 2015
    Posts
    1,885
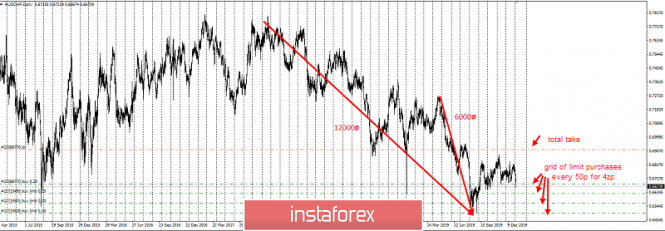
    Australian network through franc

    Good evening, dear traders. Congratulations to all Orthodox Christians on Christmas! I wish you well and financial well-being!

    As you have probably already noticed, I often trade certain cross-courses using the grid method. And today, as an example of one of them, I will show how you can spread the correct network of limit purchases on the highly oversold AUD/CHF instrument.


    Please note that such counter-trend sets should be carried out only after fairly strong passes and an understanding of the average rollback for the pair. You can see some part of these numbers on the screen on the left with a 5-digit dimension.

    Now, if you use the lot increase coefficient, you can calculate it according to the trader's calculator.

    Good luck in trading and control the risks!

    *The market analysis posted here is meant to increase your awareness, but not to give instructions to make a trade.

    Analysis are provided byInstaForex.
    Best regards, PR Manager
    Learn more about InstaForex Company at http://instaforex.com

  9. #579
    Senior Member InstaForex Gertrude's Avatar
    Join Date
    Sep 2015
    Posts
    1,885
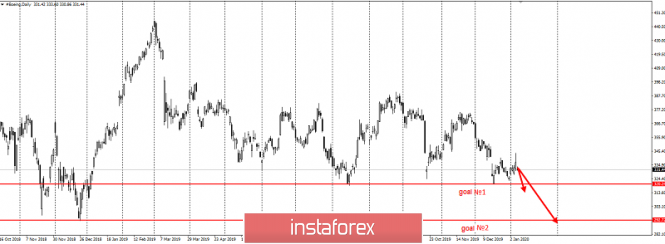
    The collapse of the Boeing after another 737 crash

    Good evening, dear traders. I present to you the trading idea for Boeing's Stock CFD.

    So, yesterday, there was a terrible catastrophe of the Ukrainian Boeing 737 in Iran. Boeing fell shortly after takeoff and all 170 passengers died. Now, for the preliminary version: technical - engine fire. This is not the first crash with a Boeing in recent times. Thus, we recommended selling the shares that were mentioned back in December.

    Boeing has a very interesting level of $ 318 from the point of view of hunting for stops. In fact, this is a platform with the feet of buyers of this asset for the entire last year. 737 was discontinued in December, but accidents continued with it. Against this background, we recommend holding short positions in order to break through the level of 319 with a further pull to historical 292:


    Since the opening, the shares have lost $ 4. Therefore, we recommend developing the reduction to the above levels if you are not yet on sale.

    Good luck in trading and control the risks!

    *The market analysis posted here is meant to increase your awareness, but not to give instructions to make a trade.

    Analysis are provided byInstaForex.
    Best regards, PR Manager
    Learn more about InstaForex Company at http://instaforex.com

  10. #580
    Senior Member InstaForex Gertrude's Avatar
    Join Date
    Sep 2015
    Posts
    1,885
    Forecast for GBP/USD on January 10, 2020

    GBP/USD
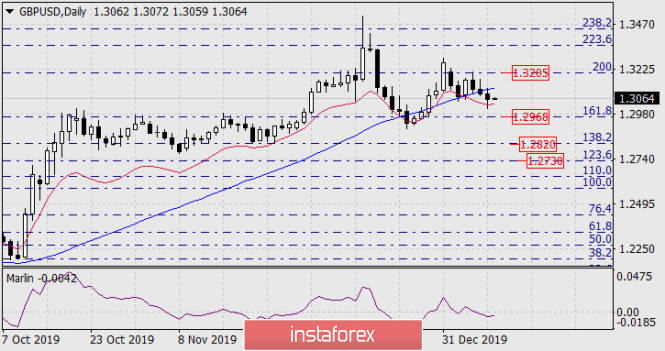
    The British pound lost 30 points on Thursday. The price consolidated below the MACD line on the daily chart. The signal line of the Marlin oscillator is falling in the negative trend zone, but not due to the strong dynamics of the pound's decline, the balance indicator line (red) continues to hold the price, further slowing its decline. The continuation of such a tendency - a decrease in the British pound will lead to an increase in bullish sentiment, the market can take advantage of such confusion.


    Data on US employment will be published today, the forecast for new jobs in the non-agricultural sector for December is 162 thousand, this may be an incentive to further pull down the pound to the Fibonacci level of 161.8% at the price of 1.2968. But even in this case, the pound's decline rate may not be enough to overcome the balance indicator line. If it also remains below the price by the opening of Monday, then the correction of the British pound is possible next week. The 1.2968 level is technically strong.


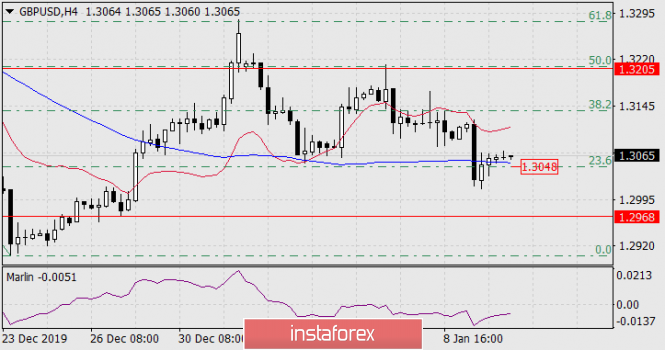
    On the four-hour chart, the price consolidated below the MACD line yesterday - one candle with the whole body was under this line, but at the moment the price is already above the MACD line. Such a false signal is also a sign of a short downward movement, if any (to our target 1.2968). The Marlin oscillator is moving after the price, it is not providing signals. Another price consolidation below the MACD line, as well as under the correction level of 23.6%, will open the nearest target at 1.2968. To move the price to lower targets (1.2820, 1.2730), which are marked on the daily scale, you need a rapid movement of the price down today.

    *The market analysis posted here is meant to increase your awareness, but not to give instructions to make a trade.

    Analysis are provided byInstaForex.
    Best regards, PR Manager
    Learn more about InstaForex Company at http://instaforex.com

Page 58 of 164 FirstFirst ... 8 48 56 57 58 59 60 68 108 158 ... LastLast

Tags for this Thread

Bookmarks

Posting Permissions

  • You may not post new threads
  • You may not post replies
  • You may not post attachments
  • You may not edit your posts
  •