
 1Likes
 LinkBack URL
 About LinkBacks


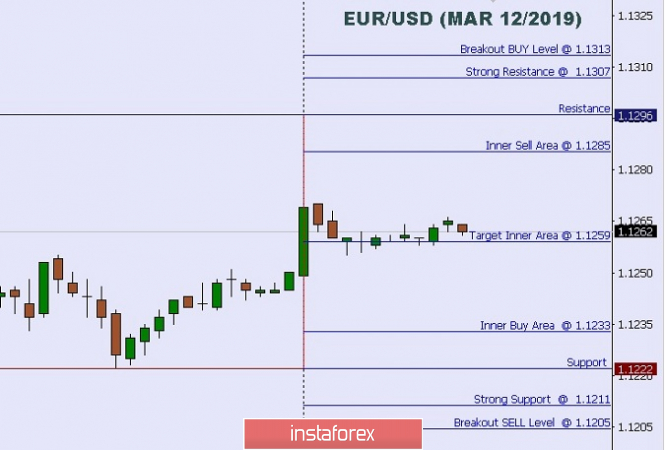
Technical analysis: Intraday Level For EUR/USD, Mar 12, 2019
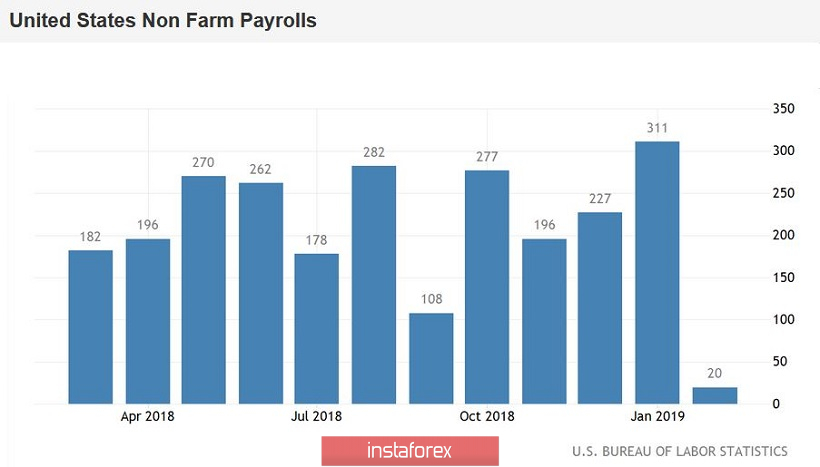
When the European market opens, some economic data will be released such as French Final Private Payrolls q/q. The US will also publish the economic data such as 10-y Bond Auction, Core CPI m/m, CPI m/m, and NFIB Small Business Index, so amid the reports, the EUR/USD pair will move with a low to a medium volatility during this day.
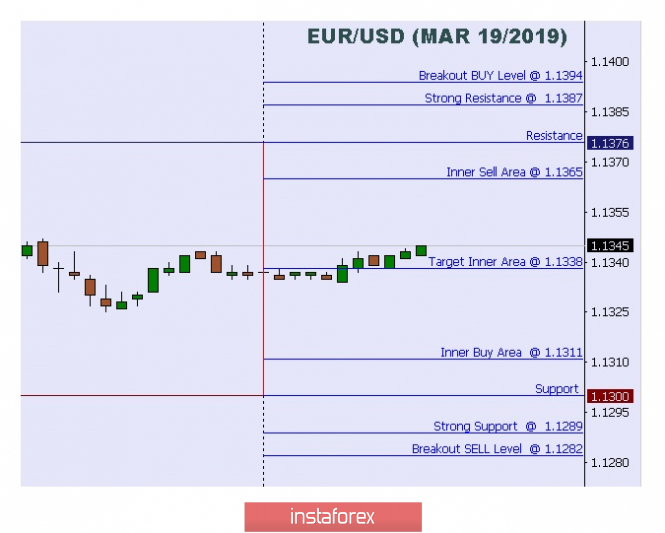
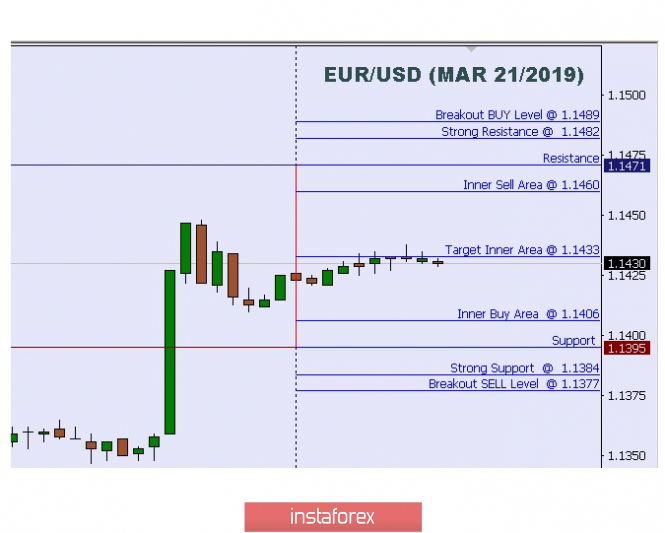
TODAY'S TECHNICAL LEVEL:
Breakout BUY Level: 1.1313.
Strong Resistance:1.1307.
Original Resistance: 1.1296.
Inner Sell Area: 1.1285.
Target Inner Area: 1.1259.
Inner Buy Area: 1.1233.
Original Support: 1.1222.
Strong Support: 1.1211.
Breakout SELL Level: 1.1205.
Analysis are provided byInstaForex.


 Reply With Quote


Bookmarks