
 1Likes
 LinkBack URL
 About LinkBacks


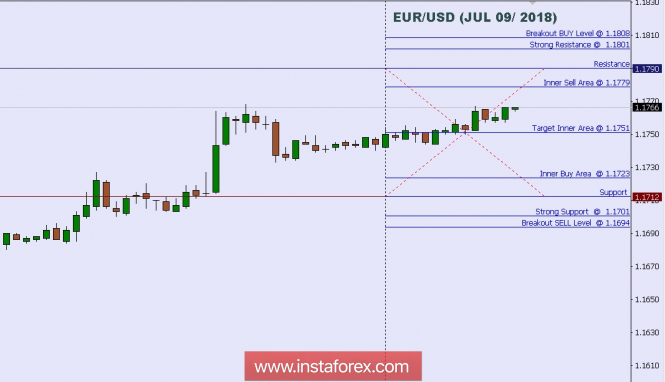
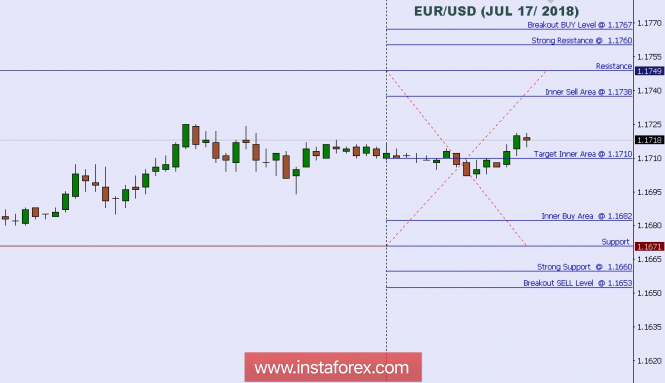
Technical analysis: Intraday Level For EUR/USD, July 09, 2018
When the European market opens, some Economic Data will be released such as Sentix Investor Confidence, and German Trade Balance. The US will also release the Economic Data such as Consumer Credit m/m, so amid the reports, EUR/USD will move in a low to medium volatility during this day.
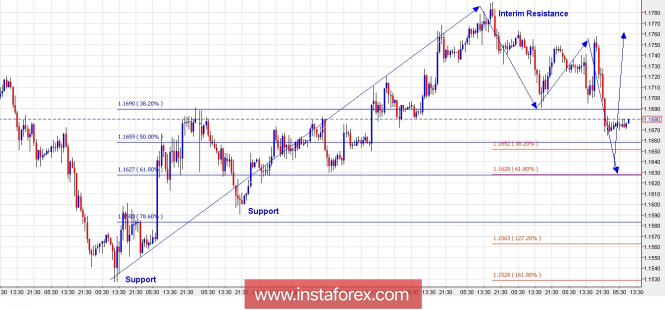
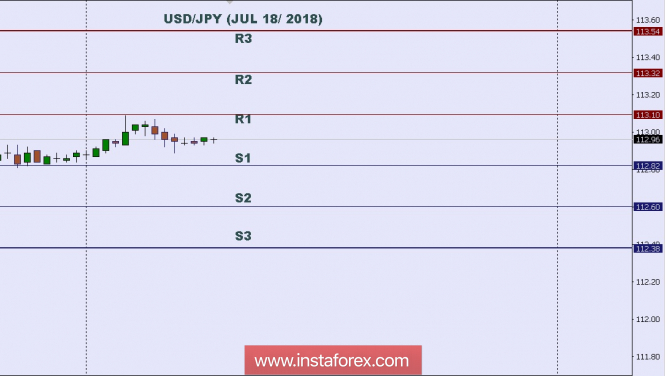
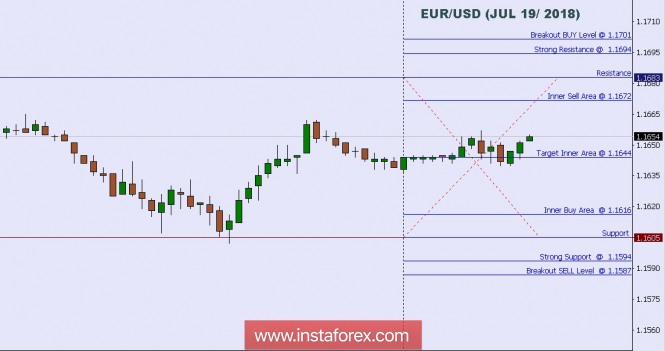
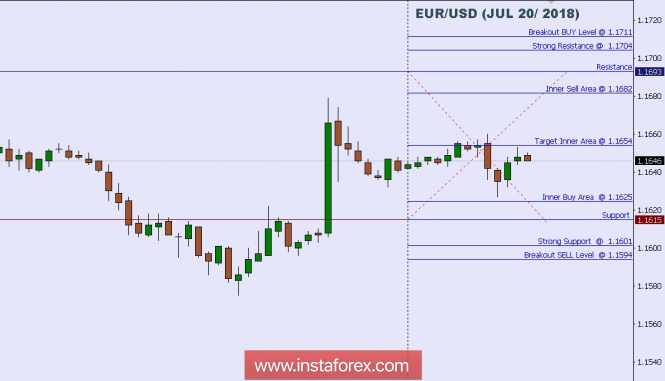
TODAY'S TECHNICAL LEVEL:
Breakout BUY Level: 1.1808.
Strong Resistance:1.1801.
Original Resistance: 1.1790.
Inner Sell Area: 1.1779.
Target Inner Area: 1.1751.
Inner Buy Area: 1.1723.
Original Support: 1.1712.
Strong Support: 1.1701.
Breakout SELL Level: 1.1694.
Analysis are provided byInstaForex.


 Reply With Quote


Bookmarks