Gold was trapped
The news about the resignation of the chief economic adviser to the president Gary Cohn allowed gold to mark its best daily level since Valentine's Day. If an ardent opponent of protectionism, an ex-candidate for the presidency of the Fed, withdraws from his post, a potential global trade war is unlikely to be avoided. And in it, all weapons will look good. Including - large-scale selling of US Treasury bonds by the main holders in the face of China and Japan. I believe other countries will do the same. Their desire to get rid of the power of the dollar will force them to shift to gold. Thus, trade wars are potentially capable of providing the precious metal with invaluable support.
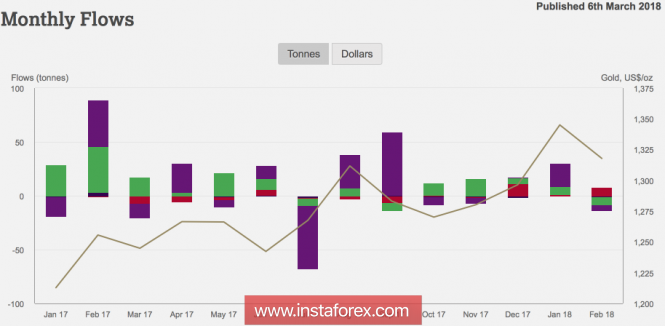
Until March, investors' demand for ETF products was characterized by mixed dynamics. The fall in the XAU/USD and the increase in gold volatility contributed to an outflow of 5.1 tonnes in February. The biggest losses were suffered by European (-7.3 tons) and North American stock-exchange specialized funds (-5.1 tons), while Asians, on the contrary, replenished their reserves (+7.9 tons). As a result, according to the latest figure, it has increased by 10% since the beginning of the year.
Monthly dynamics of demand for ETF products
Source: WGC.
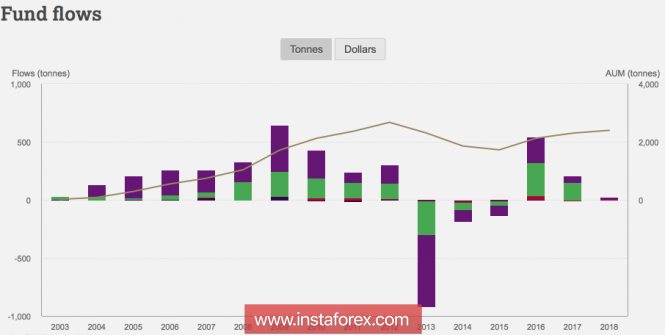
Annual dynamics of demand for ETF products
Source: WGC.
In my opinion, the value of the investment demand for precious metals was influenced by the strengthening of the US dollar. The fastest growth in the weekly wage in January over the past few years has strengthened the risks of overclocking inflation and the aggressive monetary tightening of the Fed. Moreover, the new head of the Federal Reserve was optimistic about the US economy and the way of betting on federal funds. The President of the Federal Reserve Bank of New York, William Dudley, indicated four hikes in 2018 - a gradual normalization of monetary policy. As a result, the futures market increased the chances of such an outcome to 34%, and gold plunged into a wave of selling. Everyone remembers perfectly how uncomfortable it felt at the eve of the historic FOMC meetings in 2017.
Nevertheless, the growing likelihood of the implementation of the policy of anti-globalization, Donald Trump, significantly tempered investors' appetite for risk. If the stock indexes behaved rather restrained in response to the high-sounding statements of the US president on tariffs on the import of steel and aluminum, the resignation of Gary Cohn convinced that the matter should be taken very seriously.
In the medium term, gold can be trapped in consolidation: on the one hand, news about the trade war will provide support to the bulls on the XAU/USD; on the other hand, the return of the divergence idea in the monetary policy of the Federal Reserve and the central banks-peers can become a saving straw for the US dollar. In my opinion, in the second and third quarters, against the background of the return of the normalization theme, its strength will run out, so the price will drop to the lower border of the trading range of $1300-1360 per ounce, which makes sense to use for purchases.
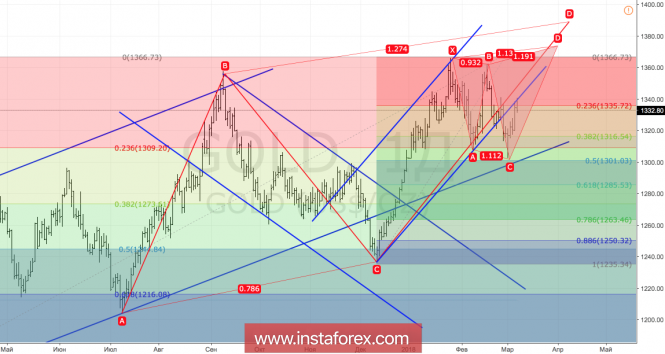
Technically, if the bulls manage to return gold quotes to the limits of the upward medium-term trading channel, then the risks of implementing the target values by 113% and by 127.2% according to the Shark and AB = CD patterns will increase. Gold, daily chart
Analysis are provided byInstaForex.


 2Likes
 LinkBack URL
 About LinkBacks



 Reply With Quote


Bookmarks