
 LinkBack URL
 About LinkBacks


GBPUSD H4 Technical and Fundamental Analysis for 07.11.2024
Time Zone: GMT +3
Time Frame: 4 Hours (H4)
Fundamental Analysis:
The GBP/USD news analysis today is influenced by various economic indicators and news events from both the United Kingdom and the United States. The UK economy is currently facing challenges related to inflation, GDP growth, and trade balance, while the US is experiencing fluctuations due to inflation data, employment figures, and Federal Reserve policies. Today's economic calendar for the USD includes high-impact events such as the Core CPI, CPI m/m, and CPI y/y reports, which are critical indicators of inflation and can significantly impact the USD's value. Additionally, the Unemployment Claims report is expected, which will provide insights into the US labor market. For the GBP, recent releases include GDP, construction output, and trade balance data, which collectively shape the market sentiment toward the GBP.
Price Action:
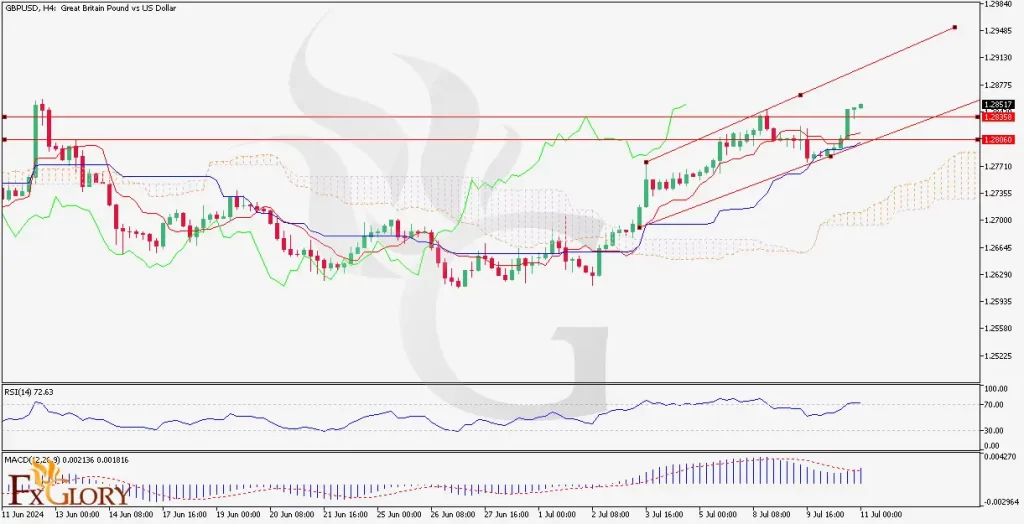
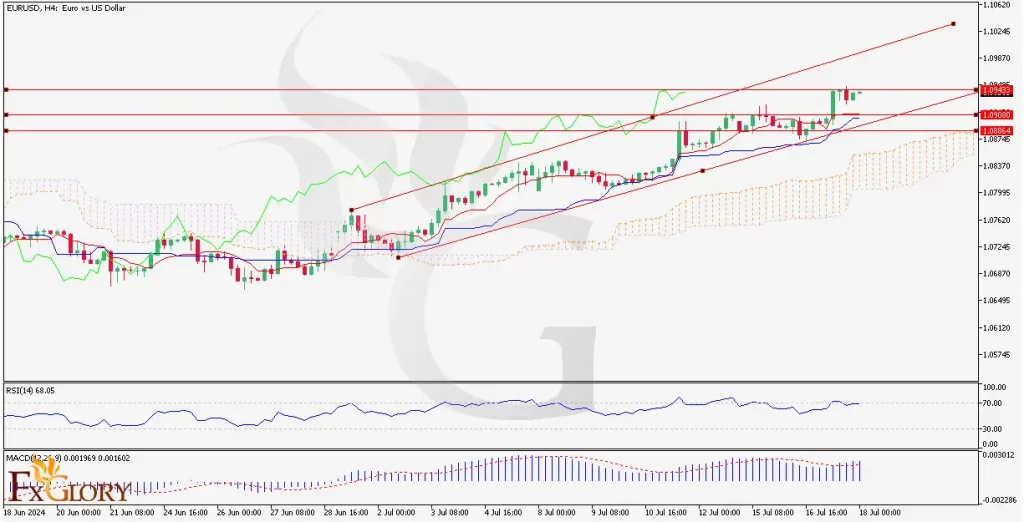
The GBP/USD H4 chart reveals the pairs strong bullish trend with the Cables price action moving within an ascending channel. The pair has recently bounced off the lower boundary of the channel, indicating a potential continuation of the upward movement. The price is currently testing a key resistance level around 1.2850. A breakout above this level could lead to further gains, while a rejection might see the price retrace towards the support level.
[B]Key Technical Indicators: [B]
Ichimoku Cloud:
The price is above the Kumo (cloud), indicating a bullish trend. The Tenkan-sen (red line) is above the Kijun-sen (blue line), further supporting the bullish momentum. The Chikou Span (green line) is also above the price, confirming the uptrend.
RSI (Relative Strength Index):
The RSI is currently at 72.63, indicating overbought conditions. This suggests that the price may face some resistance and could potentially see a pullback or consolidation before resuming its upward trend.
MACD (Moving Average Convergence Divergence):
The MACD histogram is positive, and the MACD line is above the signal line, indicating bullish momentum. This supports the continuation of the upward movement in the GBP/USD pair.
[B]Support and Resistance: [B]
Support Levels:
The nearest support level is at 1.2806, followed by a stronger support around 1.2700, which is aligned with the lower boundary of the ascending channel.
Resistance Levels:
The immediate resistance level is at 1.2850. If the price breaks above this level, the next significant resistance is around 1.2940.
Conclusion and Consideration:
The GBP/USD forecast today on the pairs H4 chart is exhibiting strong bullish momentum, supported by positive signals from the Cables technical analysis today, and key indicators such as the RSI, Ichimoku Cloud, and MACD. Traders should
monitor the price action around the 1.2850 resistance level for potential breakouts or reversals. Given the overbought condition indicated by the RSI, a pullback to support levels around 1.2806 or 1.2700 is possible before the pair resumes its upward trend. It's crucial to stay updated with the upcoming high-impact economic releases from the US, particularly the CPI reports and Unemployment Claims, as they can significantly influence the USD and, consequently, the pair itself.
Disclaimer: The provided analysis is for informational purposes only and does not constitute investment advice. Traders should conduct their own research and analysis before making any trading decisions.
FXGlory
07.11.2024


 Reply With Quote


Bookmarks