
 4Likes
 LinkBack URL
 About LinkBacks


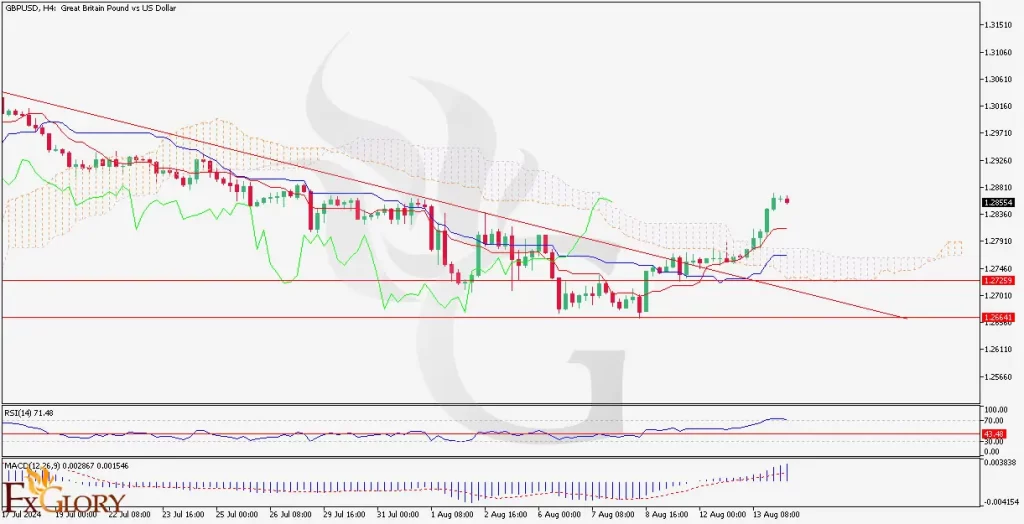
GBPUSD H4 Technical and Fundamental Analysis for 14.08.2024
Time Zone: GMT +3
Time Frame: 4 Hours (H4)
Fundamental Analysis:
The GBP/USD forecast today is shaped by ongoing developments in the UK and US economies. In the UK, recent data has shown a slight increase in the unemployment rate, which could suggest a cooling labor market, while inflation remains elevated, keeping the Bank of England on alert for further rate hikes. In the US, economic indicators like the Consumer Price Index (CPI) have shown resilience, keeping the Federal Reserve on a tightrope between taming inflation and sustaining economic growth. These factors create a complex environment for GBP/USD, as traders weigh the relative strength of both currencies.
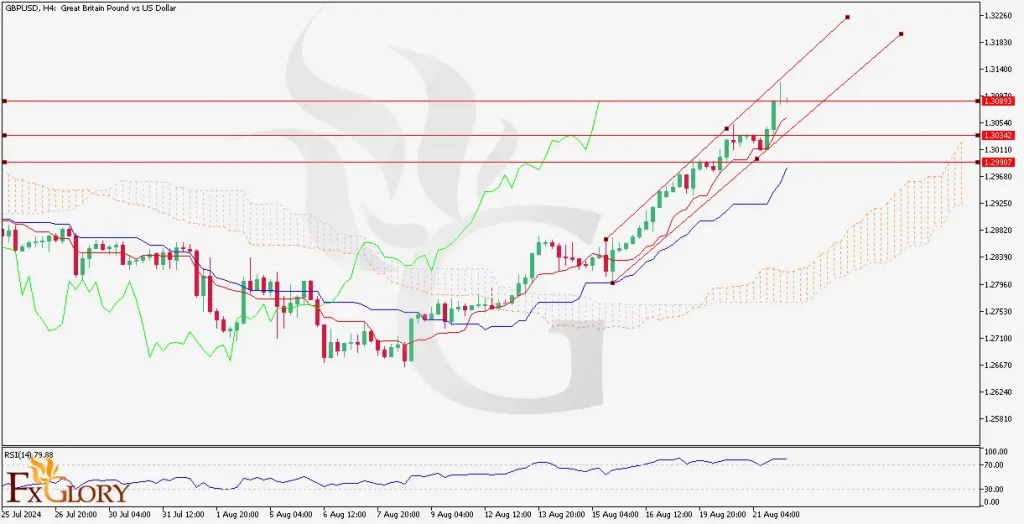
Price Action:
The GBP/USD price recently broke above a significant dynamic resistance zone, indicating a potential end to the bearish phase that has dominated the market. The price action suggests that the pair is now entering a consolidation phase after this breakout, with the possibility of retesting the recently broken dynamic support zone before continuing its upward trajectory.
Key Technical Indicators:
RSI (Relative Strength Index): The RSI is currently in the overbought territory, hovering around 72. This suggests that the pair may be due for a short-term correction or consolidation before resuming its upward movement.
MACD (Moving Average Convergence Divergence): The MACD shows a strong buy signal, with the histogram indicating increasing bullish momentum. This aligns with the recent breakout above the resistance zone, supporting the case for further upside potential.
Support and Resistance:
Support Levels:
The nearest support is at 1.27353, which corresponds to the dynamic support zone recently broken. A retest of this level could provide a strong buying opportunity and this situation is predicted for GBPUSD. Additional support is noted at 1.26641, which would be critical if the pair sees a deeper pullback.
Resistance Levels:
Immediate resistance is seen around 1.28850. This area is forecasted to be an important area for GBPUSD A break above this level could accelerate the bullish trend. Further resistance is noted at 1.29410, which would be the next target for bulls if the current momentum continues.
Conclusion and Consideration:
The GBP/USD H4 chart analysis suggests that the bearish phase may have concluded, with the price now likely to enter a bullish trend following a potential retest of the dynamic support zone. However, traders should be cautious of the RSI being in overbought territory, indicating a possible short-term pullback or consolidation. The strong buy signal from the MACD further reinforces the potential for continued upward movement after any correction. As always, market participants should monitor upcoming economic data and global developments, adjusting their strategies accordingly.
Disclaimer: The provided analysis is for informational purposes only and does not constitute investment advice. Traders should conduct their own research and analysis before making any trading decisions.
FXGlory
14.08.2024


 Reply With Quote


Bookmarks