Page 1 of 12 1 2 3 11 ... LastLast
Results 1 to 10 of 114

Daily Forex Analysis By FXGlory

This is a discussion on Daily Forex Analysis By FXGlory within the Analytics and News forums, part of the Trading Forum category; GBP/AUD Market Outlook for 11.03.2024 Time Zone: GMT +2 Time Frame: 4 Hours (H4) On the 11th of March 2024, ...


  1. #1
    Senior Member FXGlory Ltd's Avatar
    Join Date
    Mar 2024
    Posts
    115

    Visit FXGlory Ltd's Youtube Channel

    Smile Daily Forex Analysis By FXGlory

    GBP/AUD Market Outlook for 11.03.2024


    Time Zone: GMT +2
    Time Frame: 4 Hours (H4)


    On the 11th of March 2024, the GBP/AUD pair exhibits a bullish pattern on the H4 timeframe, indicating a shift from its recent downtrend to establishing higher highs and lows. This movement suggests an increasing confidence among traders in the GBP/AUD market. The interplay of the UK's economic policies, including Bank of England's strategic decisions and Brexit's unfolding, alongside Australia's economic health, heavily influenced by its commodity exports and its trade interactions with China, foreshadows a dynamic landscape that could drive the pair's volatility. The technical indicators lean towards a bullish forecast, underscored by the price's rise above the Ichimoku Cloud, an RSI standing at 54.83 that hints at bullish momentum, and a MACD that subtly points upwards. The pricing dynamics, situated between the Bollinger Bands’ middle and upper levels, outline immediate support and potential resistance areas. In light of these observations, traders are encouraged to adopt a cautiously optimistic approach, underpinned by thorough risk management strategies.


    Disclaimer: This commentary is provided for informational purposes only and should not be taken as investment advice. Individuals are urged to conduct their own research and consider their risk profile prior to making any trading decisions.


    Explore more market insights and strategic advice for trading by clicking here.


    FXGlory
    11.03.2024
    Attached Thumbnails Attached Thumbnails Daily Forex Analysis By FXGlory-fx-gbpaudh4-dailyanalysis-03.11.jpg  
    Last edited by FXGlory Ltd; 03-14-2024 at 01:28 AM.

  2. #2
    Senior Member FXGlory Ltd's Avatar
    Join Date
    Mar 2024
    Posts
    115

    Visit FXGlory Ltd's Youtube Channel

    Smile Daily Forex Analysis By FXGlory

    EURUSD analysis for 12.03.2024


    Time Zone: GMT +2
    Time Frame: 4 Hours (H4)


    A state of equilibrium characterizes the EURUSD's recent trading phase, with the price stabilization above the bullish-leaning Ichimoku cloud. The interplay of Eurozone and US economic health and policy-making remains a critical influence on the pair's dynamics. From a technical standpoint, the Ichimoku setup underscores the existing bullish tone, yet signals from the RSI and a tightening MACD allude to a possible easing of the uptrend. The chart shows support at the Ichimoku cloud's lower boundary and a secondary line at 1.0895. Meanwhile, resistance is approaching at the latest 1.0935 high, extending to 1.0954. As traders await economic updates that could sway the pair, a careful approach to risk management is essential in navigating the possible inflection points in the market.


    Disclaimer: This analysis is for informational purposes only and should not be taken as investment advice. It's crucial for traders to conduct their own research and consider their risk tolerance before trading.


    Explore in-depth market insights and strategic trading tips by clicking here.


    FXGlory
    12.03.2024
    Attached Thumbnails Attached Thumbnails Daily Forex Analysis By FXGlory-eurusdh4-daily-analysis-12.03.jpg  
    Last edited by FXGlory Ltd; 03-12-2024 at 10:27 AM.

  3. #3
    Senior Member FXGlory Ltd's Avatar
    Join Date
    Mar 2024
    Posts
    115

    Visit FXGlory Ltd's Youtube Channel

    Smile Daily Forex Analysis By FXGlory

    March 14, 2024 GBPAUD Briefing


    Time Zone: GMT +2
    Time Frame: H4


    In the four-hour chart, GBPAUD has demonstrated a consistent decline, evidenced by its trading pattern below the Ichimoku cloud and the formation of consecutive lower highs and lows. The RSI indicator, positioned below the 40 mark, implies that the downward trend has momentum behind it, a sentiment supported by the MACD's current trend. The pair finds its nearest support at 1.93285, while facing resistance at approximately 1.94715. The economic outputs from the United Kingdom and Australia, alongside the prevailing sentiment in the global risk arena, play significant roles in guiding the currency pair's direction. Adopting a strategic approach to risk management is crucial in navigating the expected fluctuations.


    Disclaimer: The information provided here is for informational purposes only, not intended as investment advice. Trading decisions should be based on personal research and an understanding of individual risk profiles.


    For detailed market insights and strategic trading recommendations, click here.

    FXGlory
    14.03.2024

  4. #4
    Senior Member FXGlory Ltd's Avatar
    Join Date
    Mar 2024
    Posts
    115

    Visit FXGlory Ltd's Youtube Channel

    Smile Daily Forex Analysis By FXGlory - EURUSD

    EURUSD analysis for 15.03.2024


    Time Zone: GMT +2
    Time Frame: 4 Hours (H4)


    The EUR/USD pair's trajectory is influenced by contrasting monetary policies from the European Central Bank and the US Federal Reserve. Current price action reflects a bearish trend as indicated by the price falling below the Ichimoku cloud on the H4 chart. Technical indicators like the MACD and RSI corroborate this view, suggesting further potential for a downward push. The current support and resistance levels are identified at 1.0885 and 1.0930, respectively.


    Disclaimer: This analysis is for informational purposes only and should not be taken as investment advice. It's crucial for traders to conduct their own research and consider their risk tolerance before trading.


    Explore in-depth market insights and strategic trading tips by clicking here.


    FXGlory
    15.03.2024

  5. #5
    Senior Member FXGlory Ltd's Avatar
    Join Date
    Mar 2024
    Posts
    115

    Visit FXGlory Ltd's Youtube Channel

    Daily Forex Analysis By FXGlory - EURUSD

    EURUSD analysis for 18.03.2024

    Time Zone: GMT +2
    Time Frame: 4 Hours (H4)


    The dance of EUR/USD continues, with its steps guided by the economic tunes from both sides of the Atlantic. The H4 dance floor shows a bearish groove with potential for a breather, as signaled by the RSI chilling below 40. But don’t be fooled—the MACD whispers tales of the bears' firm grip on the rhythm. For those looking to join the dance, keep an eye on the recent low for a support tango and the downturn's kickoff point for a resistance hustle. Keep your ears to the ground for economic beats that could flip the script, and remember, trading is a partner dance—know your moves and the market's rhythm.


    Disclaimer: This analysis is for informational purposes only and should not be taken as investment advice. It's crucial for traders to conduct their own research and consider their risk tolerance before trading.


    Get more market insights and trading strategies by clicking here.

    FXGlory
    18.03.2024
    Attached Thumbnails Attached Thumbnails Daily Forex Analysis By FXGlory-eurusd-analysis-18-03-2024.jpg  
    Last edited by FXGlory Ltd; 03-19-2024 at 05:16 AM.

  6. #6
    Senior Member FXGlory Ltd's Avatar
    Join Date
    Mar 2024
    Posts
    115

    Visit FXGlory Ltd's Youtube Channel
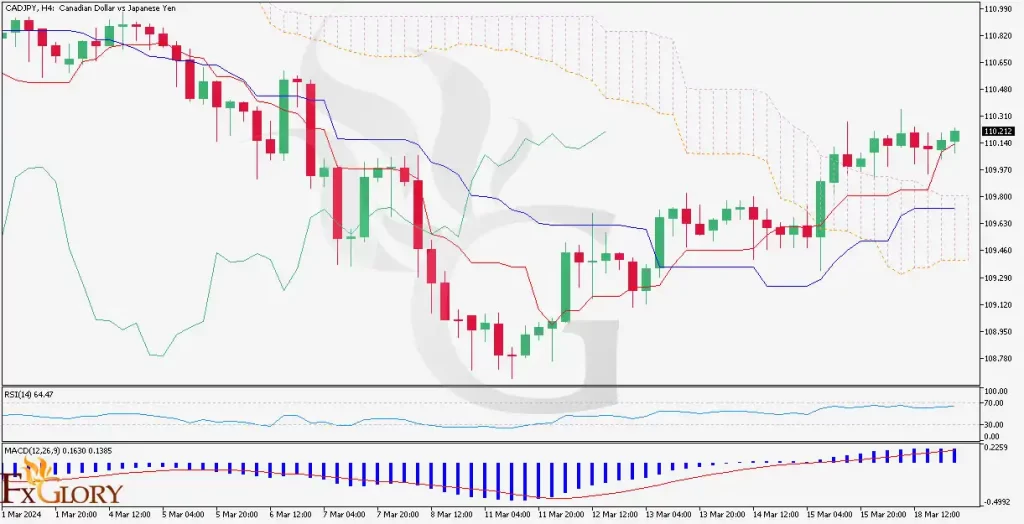
    CADJPY analysis for 19.03.2024


    Time Zone: GMT +2
    Time Frame: 4 Hours (H4)


    The CAD/JPY pair continues to climb, with technical on the H4 timeframe supporting the uptrend—RSI above 60 and a bullish MACD. With the price trend above the Ichimoku Cloud, look for potential resistance at the recent peak and support at the last higher low.


    Disclaimer: This analysis is for informational purposes only and should not be taken as investment advice. It's crucial for traders to conduct their own research and consider their risk tolerance before trading.


    Get more market insights and trading strategies by clicking here.


    FXGlory
    19.03.2024
    Last edited by FXGlory Ltd; 03-19-2024 at 08:15 AM.

  7. #7
    Senior Member FXGlory Ltd's Avatar
    Join Date
    Mar 2024
    Posts
    115

    Visit FXGlory Ltd's Youtube Channel

    GBPCAD analysis for 20.03.2024

    Time Zone: GMT +2
    Time Frame: 4 Hours (H4)


    The current narrative of the GBPCAD on the H4 canvas is one of a truce, as price action drifts along the Ichimoku Cloud’s silhouette. The RSI holds steady at 53.45, revealing a balance in market forces, while the MACD, subdued beneath the signal line, keeps a downtrend on the table. Traders should remain alert to the Ichimoku structure for trading cues and pay close attention to the oil market’s heartbeat and the unfolding economic policy decisions within the UK, both of which hold sway over the currency pair's volatility.


    Disclaimer: This analysis is for informational purposes only and should not be taken as investment advice. It's crucial for traders to conduct their own research and consider their risk tolerance before trading.


    For comprehensive market insights and strategic trading tips, click here.


    FXGlory
    20.03.2024

  8. #8
    Senior Member FXGlory Ltd's Avatar
    Join Date
    Mar 2024
    Posts
    115

    Visit FXGlory Ltd's Youtube Channel

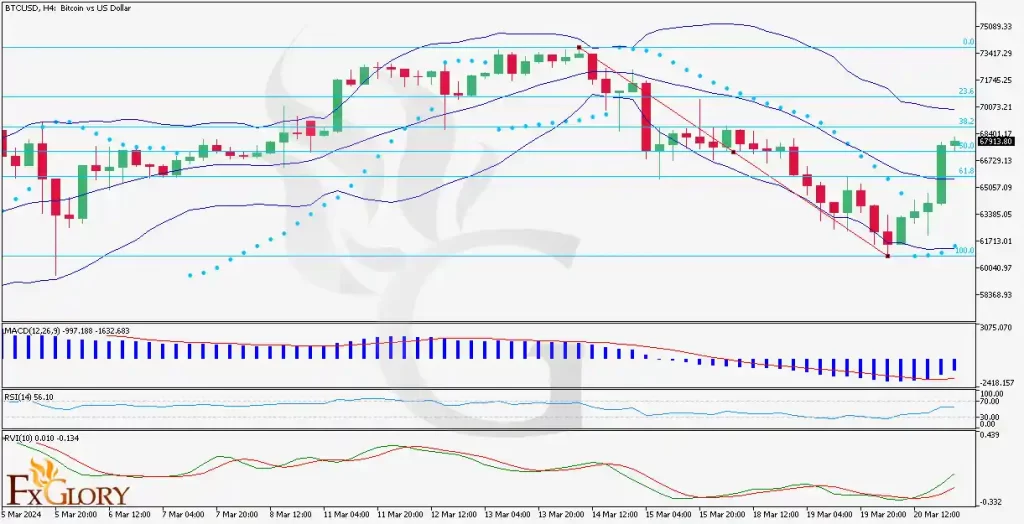
    BTCUSD analysis for 21.03.2024


    Time Zone: GMT +2
    Time Frame: 4 Hours (H4)


    On March 21, 2024, within the 4-hour (H4) timeframe, the BTCUSD pair displays a bullish momentum, characterized by an ongoing series of higher lows and peaks, suggesting a robust market turnaround and positive movement. This trend reflects Bitcoin's increasing global recognition and advancements, alongside the impact of the U.S.'s fiscal maneuvers on the USD. Analyzing from a technical perspective, we see optimistic signs, with the MACD indicating a continued positive trajectory above its signal counterpart, while the RSI points to potential expansion room without reaching saturation. Focus is particularly on the 50% Fibonacci retracement for resistance, and a notable foundation of support at the recent minimum, aligning with the Fibonacci's base level.


    Disclaimer: This summary is purely for informational purposes and is not intended as financial advice. Investors should conduct personal research and consider their financial situation before making investment decisions.


    For further detailed analysis and trading strategies, click here.


    FXGlory
    21.03.2024

  9. #9
    Senior Member FXGlory Ltd's Avatar
    Join Date
    Mar 2024
    Posts
    115

    Visit FXGlory Ltd's Youtube Channel

    Daily Forex Analysis By FXGlory

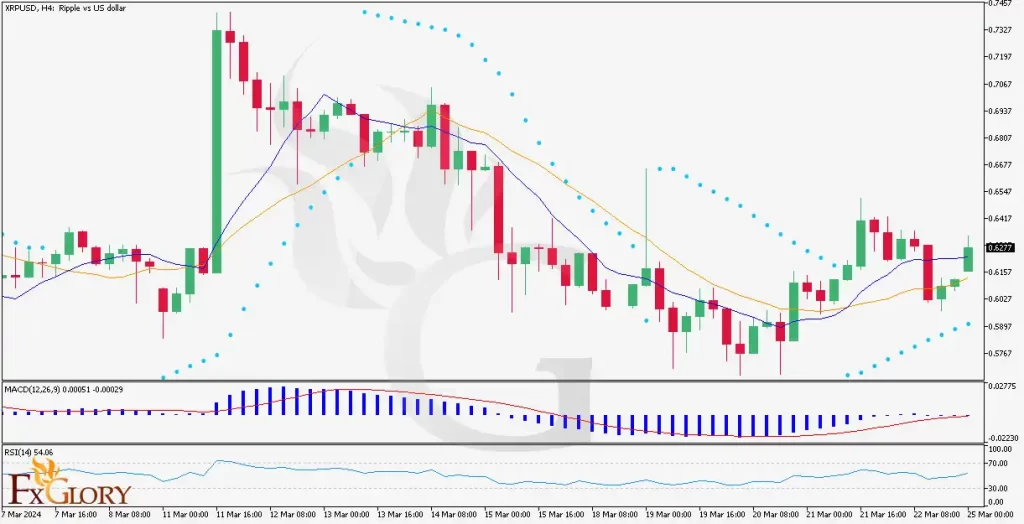
    XRPUSD Analysis Update for 25.03.2024


    Time Zone: GMT +2
    Time Frame: 4 Hours (H4)


    Reviewing the 4-hour timeframe for XRPUSD, there's noticeable bullish momentum as evidenced by its ascent above the crucial 9-period and 17-period moving averages, signaling the early stages of an uptrend. This bullish signal is further confirmed by the MACD, which exhibits a positive trend, suggesting ongoing upward momentum. The RSI, situated at a moderate 54, implies that the asset has not yet reached overbought levels, offering potential for further upward movement. Additionally, the bullish perspective is supported by the Parabolic SAR, with its indicators positioned below the price bars, hinting at continued bullish sentiment. The support level is currently established around the $0.58 - $0.60 range, with the price nearing an important resistance threshold. Overcoming this resistance might encourage more bullish activity. Investors and traders should remain vigilant to Ripple's latest developments and key economic indicators that could impact the USD.


    Disclaimer: This brief is for informational use only and should not be considered as investment advice. Traders are encouraged to conduct their own research and assess their risk tolerance before making any trading decisions.


    For further analysis and strategic trading tips, click here.


    FXGlory
    25.03.2024

  10. #10
    Senior Member FXGlory Ltd's Avatar
    Join Date
    Mar 2024
    Posts
    115

    Visit FXGlory Ltd's Youtube Channel
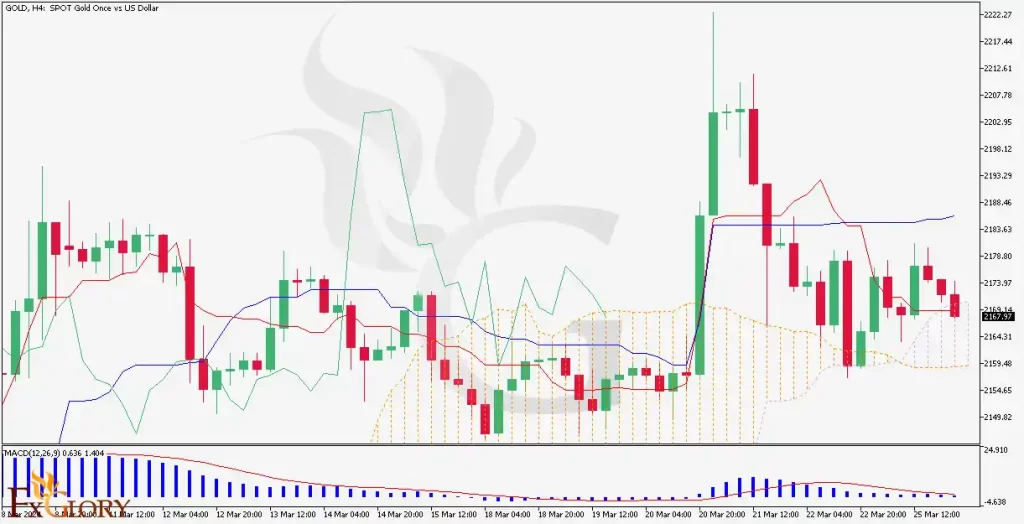
    GOLD analysis for 26.03.2024


    Time Zone: GMT +2
    Time Frame: 4 Hours (H4)


    Fundamental Analysis:
    Gold, as a traditional safe-haven asset, is impacted by global economic conditions, monetary policies, and geopolitical tensions. Interest rate changes and inflationary pressures can significantly influence gold prices. The demand for gold from consumers, investors, and central banks also plays a pivotal role in its valuation. Currently, market sentiment towards gold could be driven by such fundamental factors.


    Price Action:
    The GOLD H4 chart shows a fluctuating trend with a recent sharp rise followed by consolidation. This pattern reflects a market with mixed sentiment, where both buyers and sellers are struggling for dominance. The latest candlesticks are relatively small and close to each other, indicating indecision in the market.


    Key Technical Indicators:
    MACD (Moving Average Convergence Divergence): The MACD histogram is below the baseline, suggesting bearish momentum. However, the lines are converging, indicating a potential shift in momentum.
    Ichimoku Kinko Hyo: The price is currently below the Ichimoku cloud, which could be interpreted as bearish. The recent crossover of the Tenkan-sen above the Kijun-sen may hint at a possible change in trend.


    Support and Resistance:
    Support: The nearest support level is around the recent lows where the price has shown a reluctance to move lower.
    Resistance: Resistance can be identified at the level where the price has peaked before retracting, indicating a level where selling pressure begins to outweigh buying pressure.


    Conclusion and Consideration:
    The H4 chart for GOLD shows a market experiencing volatility with a tendency towards bearish momentum as indicated by the MACD and the price position relative to the Ichimoku cloud. However, the recent bullish crossover in the Ichimoku indicator and the consolidation in price action suggest a cautious approach. Traders should stay alert for signs of a definitive trend and consider global economic indicators, central bank policies, and geopolitical developments that could impact gold prices. Proper risk management is essential given the unpredictability of gold markets.


    Disclaimer: This analysis is intended for informational purposes only and should not be taken as investment advice. Trading decisions should be based on individual risk tolerance, market knowledge, and thorough analysis.


    FxGlory
    26.03.2024

Page 1 of 12 1 2 3 11 ... LastLast

Bookmarks

Posting Permissions

  • You may not post new threads
  • You may not post replies
  • You may not post attachments
  • You may not edit your posts
  •